Mechanism explainer
Fitbit Sleep Tracking Review: How It Works and How Accurate It Really Is
A mechanistically grounded review of how Fitbit detects and classifies sleep — covering the sensors, the Sleep Score anatomy, and what peer-reviewed PSG validation studies say about per-stage accuracy — written for adults who want an honest answer about whether their Fitbit sleep data is trustworthy.
What Does Your Fitbit Actually Know About Your Sleep?
Every morning, millions of people check their Fitbit and see a Sleep Score, a breakdown of light, deep, and REM sleep, and a verdict on how restorative the night was. The natural question — one that almost no product review answers honestly — is: how does the device actually know any of this, and should you trust what it tells you?
The short answer is that Fitbit is genuinely useful for tracking total sleep time and detecting broad patterns across weeks, but its per-stage accuracy — particularly for deep sleep — has well-documented limits that most users never hear about. Understanding where those limits come from, and what they mean in practice, is what this article is about.
The Sensors Behind the Data: Accelerometer, PPG, and Why There Is No EEG
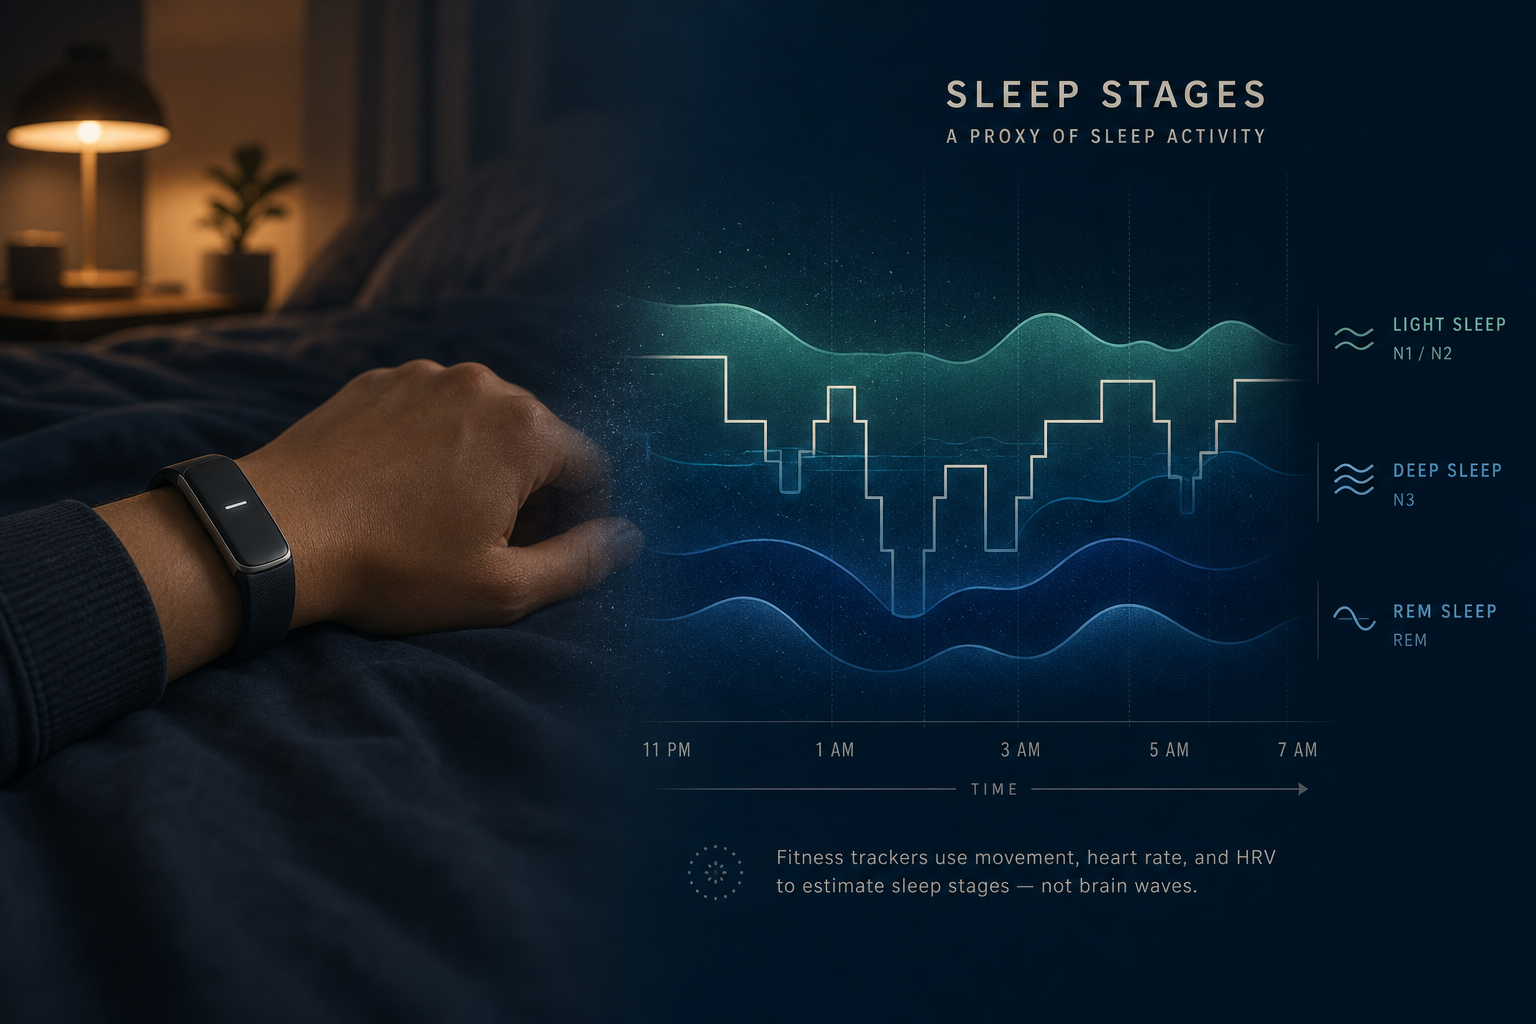
Fitbit uses two primary sensing methods to infer sleep. The first is a wrist accelerometer, which measures physical movement. Periods of stillness suggest sleep; movement suggests wakefulness. The second is photoplethysmography (PPG), a light-based sensor on the underside of the device that detects changes in blood volume with each heartbeat. From the timing patterns between beats — known as heart rate variability, or HRV — the algorithm infers shifts in autonomic nervous system activity associated with different sleep stages.
What Fitbit cannot do is measure brain electrical activity. In a clinical sleep lab, polysomnography (PSG) records electroencephalogram (EEG) signals directly from the scalp — the only direct method for identifying sleep stages with certainty. N1, N2, N3, and REM each have distinct EEG signatures. A wrist-worn device has no access to any of them.
This is not a design flaw that future hardware will easily fix. It is a fundamental constraint of wrist-based sensing. Google Health's support documentation acknowledges this directly, noting that the device uses movement and heart rate variability as proxies for the brain and muscle signals measured in clinical labs. The algorithm also requires a minimum of 20 minutes of sleep data before it will produce any stage estimates at all — meaning very short sleep episodes or fragmented nights may return incomplete staging.
- Accelerometer: detects physical movement and stillness to distinguish sleep from wakefulness at a coarse level.
- PPG sensor: measures inter-beat interval patterns (HRV) to identify autonomic shifts associated with sleep stage transitions.
- No EEG: brain electrical activity — the gold standard for sleep staging — is not measured and cannot be inferred from wrist signals alone.
- Minimum 20-minute threshold: the staging algorithm requires at least 20 minutes of continuous sleep data before producing stage estimates.
What Fitbit Reports: Sleep Score, Sleep Stages, and Supplementary Signals
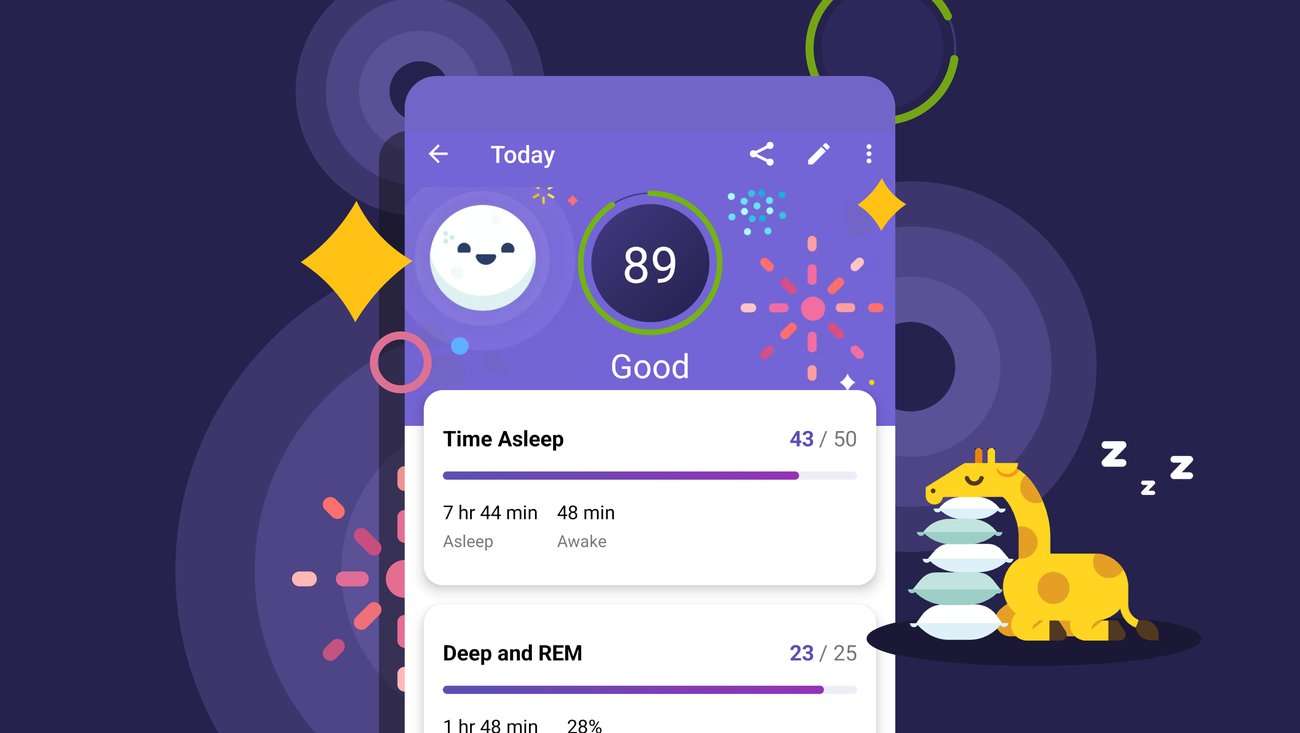
Before evaluating accuracy, it helps to understand exactly what Fitbit surfaces and what each number represents. The headline metric is the Sleep Score — a single number from 0 to 100 that summarizes the night. According to Consumer Reports, the Sleep Score is composed of three weighted components: time asleep (50%), the proportion of deep and REM sleep (25%), and restoration — defined as the time during sleep when heart rate falls below resting rate (25%).
The sleep stage breakdown groups the night into three categories: Light sleep (which captures both N1 and N2 NREM stages), Deep sleep (which corresponds to N3, slow-wave sleep), and REM sleep. These map loosely onto the four-stage PSG classification but collapse N1 and N2 into a single category, which has implications for how the data compares to clinical measurements.
| Metric | What It Measures | Score Weight |
|---|---|---|
| Sleep Score | Composite of time asleep, stage quality, and restoration | N/A (composite) |
| Time Asleep | Total sleep duration, excluding wake periods | 50% |
| Deep + REM Proportion | Combined percentage of deep and REM sleep stages | 25% |
| Restoration | Time heart rate was below resting rate during sleep | 25% |
| Sleep Stages | Light (N1+N2), Deep (N3), REM breakdown in minutes | Informs score |
| SpO2 Breathing Variation | Estimated blood oxygen saturation changes during sleep | Not scored |
| HRV Balance | Heart rate variability trend as a recovery indicator | Not scored |
| Skin Temperature Trend | Nightly deviation from personal baseline skin temperature | Not scored |
What the Research Says: PSG Validation Studies and Per-Stage Accuracy
The most comprehensive review of Fitbit's validated accuracy comes from a 2024 analysis published in the Journal of Sleep Medicine. The Park et al. review consolidated findings across multiple PSG comparison studies and provides the clearest available summary of per-stage accuracy across Fitbit devices.
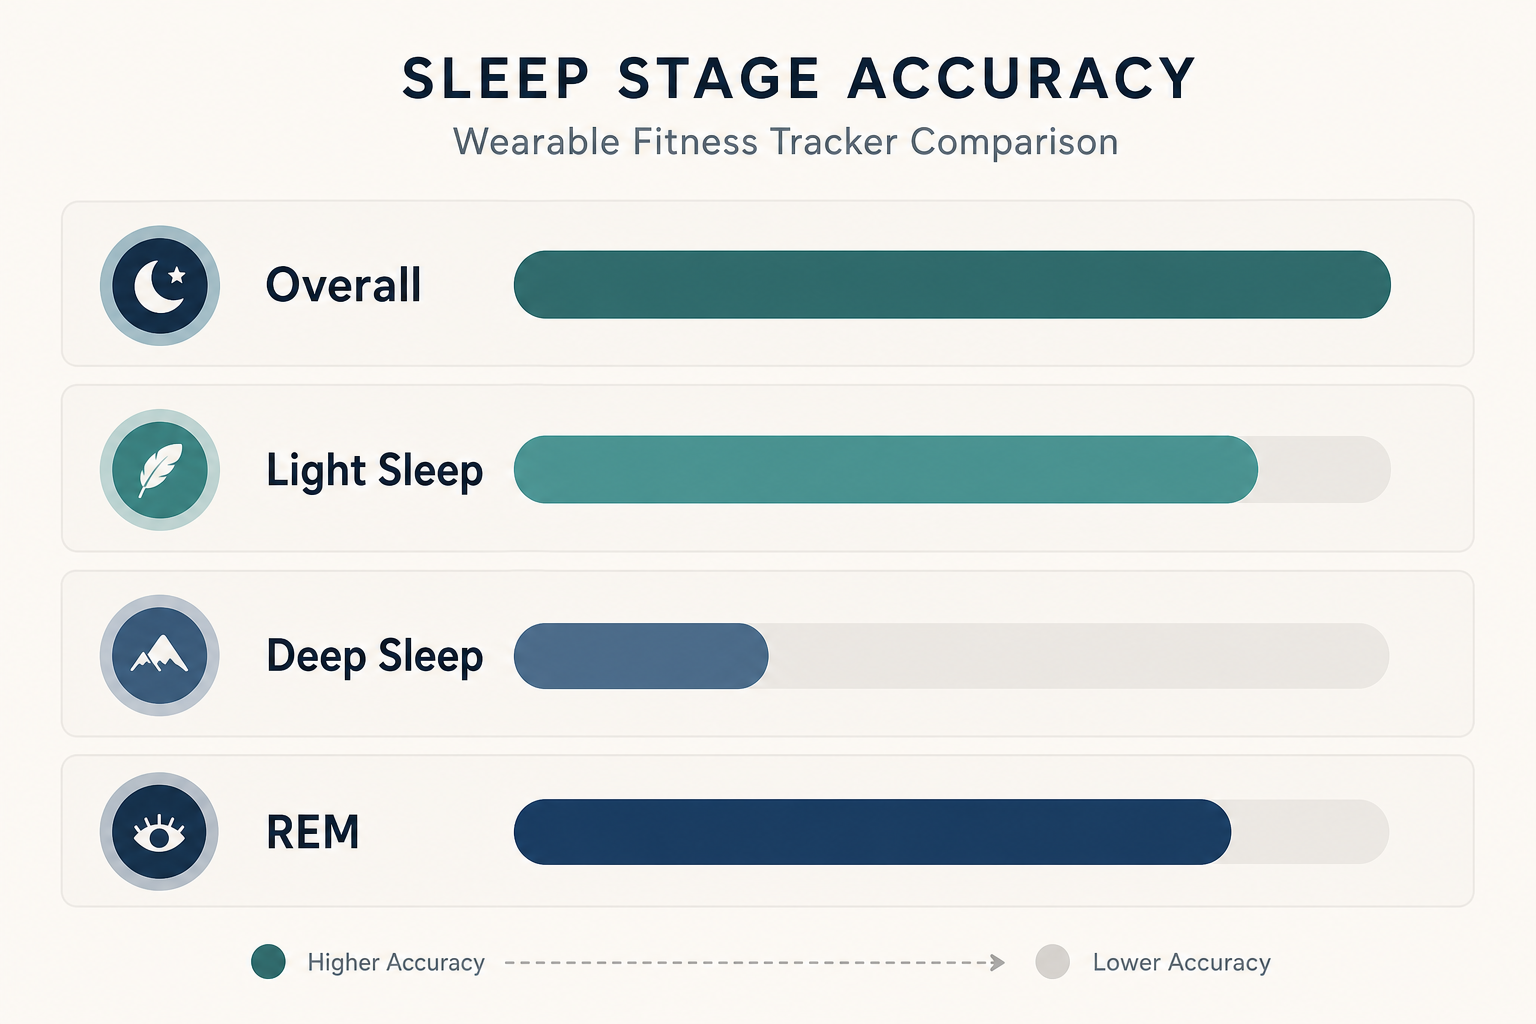
The headline binary figure — sleep versus wake detection — is reasonably strong: overall accuracy of 86.5 to 88 percent. This means Fitbit reliably identifies whether you are asleep or awake at any given moment. The picture deteriorates significantly when you look at individual stage classification.
| Sleep Stage | Accuracy / Sensitivity Range | Key Finding |
|---|---|---|
| Overall (sleep vs. wake) | 86.5–88% | Reliable for gross sleep detection |
| Light Sleep (N1+N2) | 53–81% sensitivity | Wide range; tends toward overestimation |
| Deep Sleep (N3) | 27.9–59% sensitivity (~49% central estimate) | Weakest link; systematic underestimation |
| REM Sleep | 54–74% sensitivity | Moderate; more consistent than deep |
The pattern across studies is consistent: Fitbit overestimates light sleep and underestimates deep sleep relative to PSG. In practical terms, this means that on nights when your Fitbit shows very little deep sleep, some of that time may have actually been N3 that the algorithm misclassified as light sleep — and vice versa.
A separate 2024 meta-analysis of 24 peer-reviewed studies covering more than 700 subjects found that none of the consumer wrist-worn sleep trackers produced statistically similar sleep results to PSG. Newer Fitbit models with dedicated sleep-staging algorithms did outperform older motion-only models on total sleep time and sleep efficiency estimates, but the fundamental stage-classification ceiling remained.
Google's own research team has published a preprint describing an updated machine learning algorithm for sleep staging across Fitbit and Pixel Watch devices. The updated algorithm improved four-stage Cohen's kappa — a measure of agreement beyond chance — from an average of 0.56 to 0.63, and overall accuracy from 71 percent to 77 percent. These are meaningful improvements.
Even with the updated algorithm, a kappa of 0.63 falls in the "substantial" agreement range but remains well below the level required for clinical diagnostic use. The improvement matters for trend accuracy; it does not change the fundamental advice about how to interpret single-night stage data.
Known Accuracy Limitations: What the Numbers Don't Show
The aggregate accuracy figures above describe average performance across mostly healthy adult populations in controlled studies. Several specific factors can push individual accuracy significantly lower.
Deep Sleep Is the Weakest Link
With a central sensitivity estimate of around 49 percent, N3 deep sleep classification is essentially a coin flip at the stage level. The algorithm tends to assign time that was actually N3 to the light sleep category, producing the characteristic pattern of Fitbit users who appear to get very little deep sleep relative to what population norms suggest.
Insomnia Populations Show Roughly Doubled Error Bias
The Park et al. review cites research by Menghini and colleagues showing that Fitbit's measurement bias — the systematic over- or underestimation of sleep variables — is approximately doubled in people with insomnia compared to healthy sleepers. A separate study by Dong and colleagues specifically concluded that Fitbit cannot replace PSG for measuring sleep variables or determining sleep stage classification in patients with chronic insomnia.
This matters because people with insomnia are among the most motivated users of sleep trackers. The device performs worst precisely for the population most likely to scrutinize its output.
Mode Setting Materially Affects Output
Fitbit offers a sensitivity mode setting that changes how the accelerometer interprets movement. Normal mode overestimates total sleep time and sleep efficiency by more than 10 percent. Sensitive mode underestimates both by more than 15 percent. The "right" setting does not exist — each introduces a systematic bias in a different direction, and most users are unaware the setting exists or affects their data.
Sleep Stage Transition Dynamics Are Underestimated
A study by Liang and Chapa-Martell (2019) found that Fitbit Charge 2 significantly underestimated sleep stage transition dynamics compared to PSG. The probability of staying in a given stage was overestimated, while the probability of transitioning between stages was mostly underestimated — with systematic bias ranging from 0 to approximately 60 percent. In practical terms, your Fitbit hypnogram is smoother and less dynamic than your actual sleep architecture.
Other Documented Limitations
- Wrist placement: dominant versus non-dominant wrist placement produces meaningfully different readings in some studies, and Fitbit's guidance on preferred placement varies by model.
- Minimum staging threshold: the algorithm requires at least 20 minutes of sleep before producing stage estimates; fragmented nights or very early wake-ups may return incomplete data.
- Demographic evidence gaps: most PSG validation studies used young or middle-aged healthy adults. Evidence on accuracy in adults over 65, perimenopausal women, and people with comorbid sleep disorders is sparse — the published accuracy figures may not generalize to these populations.
- Hardware generation gap: most published validation studies used Fitbit Charge 2, 3, 4, and Fitbit Sense. Accuracy figures for Charge 6 and Sense 2 (the current 2025–2026 lineup) may differ, particularly given the 2026 algorithm update, but independent peer-reviewed validation of current hardware is not yet available.
How Fitbit Compares to Oura Ring and Apple Watch
A study conducted at Brigham and Women's Hospital and published in the journal Sensors in 2024 compared Oura Ring, Fitbit Sense, and Apple Watch against simultaneous PSG recordings in 35 participants. The study found that Oura Ring was approximately 10 percent more accurate than Fitbit in four-stage sleep classification, based on Cohen's kappa scores.
| Device | Four-Stage Cohen's Kappa | Deep Sleep Sensitivity | Light Sleep Accuracy | Note |
|---|---|---|---|---|
| Oura Ring | 0.65 | 79.5% | Higher than Fitbit | Study funded by ŌURA |
| Apple Watch | 0.60 | 50.5% | Overestimated by ~45 min avg | Overestimates light and deep sleep |
| Fitbit Sense (pre-2026 algorithm) | 0.55 | 61.7% | Moderate | Post-update kappa ~0.63 |
| Fitbit (post-2026 algorithm update) | ~0.63 (preprint) | Not separately reported | Expected improvement | Preprint; not yet peer-reviewed |
With the 2026 algorithm update, Fitbit's kappa of approximately 0.63 narrows the gap with Oura Ring's 0.65 considerably — the difference becomes modest rather than substantial. Apple Watch's tendency to overestimate both light and deep sleep is a distinct pattern from Fitbit's underestimation of deep sleep; neither device reliably matches PSG at the stage level.
For most users choosing between these devices, the accuracy differences at the stage level are unlikely to change day-to-day behavior in a meaningful way. The more relevant question is form factor preference and which supplementary metrics — SpO2, skin temperature, HRV — matter most to a given user.
Orthosomnia: When Sleep Tracking Becomes Counterproductive
In 2017, Baron and colleagues published a paper in the Journal of Clinical Sleep Medicine coining the term "orthosomnia" — a perfectionist preoccupation with achieving ideal sleep data as measured by a wearable device. The paper described three clinical cases in which patients sought treatment for insomnia they had self-diagnosed based on their tracker output, resisted evidence-based treatment (CBT-I), and reinforced catastrophic thinking about sleep by treating inaccurate wearable data as clinical fact.
The authors noted a specific irony: because consumer trackers tend to overestimate total sleep time, patients who believed their device was showing them inadequate sleep were often actually sleeping more than the device reported — and the device's systematic overestimation meant the true picture was even less alarming than the number on screen. Yet the number still drove clinical distress.
No one has ever slept longer or better by trying harder.
That observation — from sleep researcher Michael Grandner, quoted in Consumer Reports — captures the core problem with anxious engagement with sleep tracker data. The effort to optimize a number that is itself imprecisely measured can become its own source of sleep disruption.
The clinical recommendation from the Baron et al. paper is not to stop using trackers but to discuss their limitations explicitly and to integrate wearable data as a supplement to — not a substitute for — validated clinical approaches like CBT-I. If you find yourself checking your Sleep Score before you assess how you actually feel, or if a low score reliably worsens your mood and functioning for the day, that pattern is worth examining.
How to Read Your Fitbit Sleep Data: A Practical Interpretation Guide
Given everything above, what is the right way to engage with Fitbit sleep data? The answer depends on which metric you are looking at. Some signals are genuinely trustworthy; others should be treated with much more skepticism.
The most important framing shift is from nightly score reading to trend monitoring. Google Health's own guidance explicitly recommends focusing on 30-day averages rather than single-night data — a recommendation that aligns directly with what the accuracy research supports.
| Metric | Trustworthiness Level | How to Use It |
|---|---|---|
| Total sleep time (TST) | Moderate-High | Track week-over-week averages; single-night figures are reasonably reliable but affected by mode setting |
| Sleep vs. wake detection | High (86–88% accurate) | Reliable for broad sleep-wake patterns and general sleep duration trends |
| Deep sleep (N3) minutes | Low (sensitivity ~49%) | Do not treat single-night figures as accurate; use only as a very rough long-term trend |
| REM sleep minutes | Moderate (sensitivity 54–74%) | More reliable than deep sleep but still imprecise; trends over weeks are more useful than nightly readings |
| Light sleep minutes | Moderate (sensitivity 53–81%) | Partially inflated due to deep sleep misclassification; treat as approximate |
| Sleep Score | Moderate as trend indicator | Useful for spotting multi-week patterns; not meaningful as a single-night clinical measure |
| SpO2 breathing variation | Useful as a flag | Persistently low or highly variable SpO2 warrants clinical follow-up for potential breathing disorders |
| HRV balance | Useful as a wellness trend | Reflects recovery and stress broadly; not a precise clinical HRV measurement |
| Skin temperature trend | Useful as a deviation flag | Consistent deviations from personal baseline (illness, hormonal shifts) are more meaningful than the absolute value |
| Restoration score | Moderate | Reflects time below resting heart rate; more physiologically grounded than stage-dependent metrics |
When to Seek a Clinical Sleep Study Instead
Fitbit data is not a substitute for clinical evaluation in the following situations:
- Your SpO2 readings show persistent low values or large night-to-night variation — this warrants evaluation for sleep-disordered breathing, including obstructive sleep apnea.
- You consistently feel unrefreshed despite the tracker showing adequate total sleep time — this may indicate a condition (sleep apnea, periodic limb movement disorder, or other) that wrist actigraphy cannot detect.
- You have been experiencing difficulty falling or staying asleep for more than three months and it is affecting daytime functioning — this meets criteria for chronic insomnia, and CBT-I with a clinician is the evidence-based first-line treatment.
- You are relying on tracker data to make decisions about medication, supplements, or clinical care — consumer wearable data is not designed for that purpose.
Summary: What Fitbit Sleep Tracking Is Good For — and What It Isn't
Fitbit sleep tracking is a useful tool when used for what it is actually good at: detecting whether you slept, roughly how long, and how those patterns change over weeks and months. Its binary sleep-versus-wake accuracy of 86 to 88 percent makes it a reliable gross sleep detector. Its SpO2 signal is a reasonable flag for potential breathing issues that warrant follow-up. Its HRV and skin temperature trends provide genuine supplementary context about recovery and physiological state.
What it is not good at is precisely what most users focus on: the per-stage breakdown, especially deep sleep. With a sensitivity of roughly 49 percent for N3, a single night's deep sleep reading is closer to an estimate than a measurement. The algorithm systematically overestimates light sleep and underestimates deep sleep, performs materially worse in people with insomnia, and produces a smoother hypnogram than your actual sleep architecture.
| Use Case | Fitbit's Suitability | Practical Recommendation |
|---|---|---|
| Tracking total sleep time over weeks | Well-suited | Use 30-day averages; note mode setting affects absolute figures |
| Detecting broad sleep-wake patterns | Well-suited | Reliable at 86–88% binary accuracy |
| Monitoring SpO2 for breathing flags | Reasonably suited | Investigate persistent low or variable readings with a clinician |
| Tracking HRV and recovery trends | Moderately suited | Useful as a wellness signal; not a clinical HRV measurement |
| Knowing exactly how many minutes of deep sleep you got last night | Poorly suited | ~49% sensitivity; treat as a rough estimate, not a measurement |
| Diagnosing or ruling out a sleep disorder | Not suited | Requires clinical evaluation; wearable data is not diagnostic |
| Guiding CBT-I or clinical treatment decisions | Not suited | Clinical tools and validated assessments are required |
The 2026 Google algorithm update is a genuine improvement — kappa rising from 0.56 to 0.63 is meaningful progress — but it does not change the fundamental advice. Use the trend, not the nightly number. Use the SpO2 as a flag, not a diagnosis. And if your sleep is genuinely affecting how you function, the data on your wrist is a starting point for a conversation with a clinician, not a substitute for one.
Supports these guides
Spot an error or have clinical feedback?
Because this article covers clinical, medication, or safety information, we use a moderated correction channel instead of open public comments. Let us know if something about “Fitbit Sleep Tracking Review: How It Works and How Accurate It Really Is” needs a closer look.
Send feedback on this article