Mechanism explainer
Garmin Sleep Tracking: Accuracy, Metrics, and How It Compares
An evidence-anchored breakdown of how Garmin's sleep tracking works, what each metric actually measures, and what independent PSG research reveals about its accuracy — including where Garmin leads and where it falls short compared to Oura, Fitbit, and Apple Watch.
Garmin's sleep tracking is more sophisticated than a basic motion counter, but less reliable than many users assume when they see a detailed breakdown of light, deep, and REM sleep each morning. The gap between what the app displays and what independent research confirms is the central issue this guide addresses.
What follows is a metric-by-metric evidence review — not a purchase recommendation. If you own a Garmin device and want to know which readouts to trust, which to treat as rough directional signals, and which to largely ignore, this is the breakdown that serves that task.
How Garmin Tracks Sleep: Sensors and Algorithm
Garmin's sleep tracking system, branded as Advanced Sleep Monitoring (ASM), uses three hardware inputs simultaneously: a photoplethysmography (PPG) sensor for heart rate and pulse waveform data, an accelerometer for movement detection, and heart rate variability (HRV) derived from the PPG signal. These inputs are combined and processed by a cloud-based neural network algorithm running through Garmin Connect rather than on the watch itself.
The neural network classifies each 30-second epoch of the night into one of four states: wake, light sleep (N1/N2), deep sleep (N3), or REM. The classification draws primarily on HRV patterns and movement signals, since PPG-based pulse waveform changes correlate — imperfectly — with the autonomic shifts that accompany different sleep stages.
One architectural detail matters for interpreting Garmin accuracy data over time: the ASM algorithm is updated through Garmin Connect independently of watch firmware. This means the same physical hardware can produce meaningfully different outputs after a software update. Reviews and studies conducted at different points in time may reflect different algorithm versions — a complication when comparing published research findings to your own device's current behavior.
Garmin also tracks SpO2 (blood oxygen saturation) and breathing rate on compatible devices, and uses the combination of sleep and activity data to generate its Body Battery and HRV Status features. These composite metrics are distinct from the raw sleep stage classification and have different reliability profiles, addressed in the metric breakdown below.
What Each Sleep Metric Means — and How Reliable It Is
Not all Garmin sleep outputs carry the same level of confidence. Some reflect aggregated trends that are relatively robust; others are epoch-level classifications with high uncertainty. Understanding the difference is more useful than treating the app as a unified dashboard of equally reliable numbers.
| Metric | What It Measures | Reliability Assessment |
|---|---|---|
| Total Sleep Duration | Time classified as any sleep stage from sleep onset to final wake | Moderate — tends to overestimate vs. PSG by roughly 40–45 minutes; more reliable as a week-to-week trend than a nightly absolute |
| Sleep Stages (Light/Deep/REM %) | Proportion of night spent in each classified stage | Low for individual nights — epoch-level stage misclassification is common across all consumer wearables; treat percentages as rough indicators, not clinical measurements |
| WASO (Wake After Sleep Onset) | Total time awake after initial sleep onset | Low — Garmin substantially underestimates WASO vs. PSG; the most problematic metric for people with sleep-maintenance difficulties |
| Sleep Score | Composite score (0–100) combining duration, stage quality, and restfulness signals | Directional only — useful for spotting multi-day patterns; do not interpret single-night scores as clinical assessments |
| Body Battery | Energy reserve estimate derived from HRV, stress, sleep, and activity over time | Moderate-to-good for directional trends — recovery direction (charging vs. draining) is more meaningful than the specific number |
| HRV Status | Nightly HRV baseline and deviation from personal baseline | Moderate — HRV measurement via PPG is less precise than ECG-based HRV, but baseline deviation trends are meaningful over weeks |
| SpO2 / Breathing Variation | Estimated blood oxygen and breathing irregularity during sleep | Screening-level only — can flag potential respiratory disturbance patterns but is not a substitute for clinical sleep apnea evaluation |
Sleep Duration: The Most Reliable Output
Total sleep time is Garmin's strongest individual metric, though it still carries a systematic overestimation bias. The device tends to count some quiet wakefulness as sleep, particularly during periods of low movement. This inflates the nightly total by roughly 40 minutes on average versus polysomnography. The practical implication: if Garmin reports 7.5 hours, your actual sleep time was likely closer to 7 hours.
Despite this bias, duration trends across weeks are meaningful. If your reported sleep consistently drops from 7.5 hours to 6.5 hours during a stressful period, that directional signal is real even if the absolute numbers are inflated.
Sleep Stage Percentages: High Uncertainty
The detailed breakdown of light, deep, and REM sleep is the most visually prominent feature of the Garmin sleep interface and the least reliable. Across consumer wearables generally, devices fail to correctly identify 30–50% of deep and REM epochs at the individual epoch level when compared to polysomnography. Garmin's stage classification is no exception.
Garmin's own sponsored research, conducted at the University of Kansas in 2019 using a home EEG (Sleep Profiler) as the reference standard rather than full PSG, reported approximately 69.7% overall sleep stage accuracy with a Cohen's kappa of 0.54. A kappa of 0.54 indicates moderate agreement — meaning roughly one in three epochs is misclassified even under the more favorable home EEG comparison. Against full PSG, agreement would likely be lower.
What Independent Research Says About Garmin's Accuracy
The most rigorous independent assessment of Garmin's sleep tracking accuracy comes from a 2021 study by Chinoy and colleagues, conducted at the Naval Health Research Center and published in Sleep. The study compared seven consumer wearables — including the Garmin Fenix 5S and Vivosmart 3 — against simultaneous polysomnography in a controlled sleep laboratory setting.
| Accuracy Measure | Garmin Finding (Chinoy 2021) | Context |
|---|---|---|
| Total Sleep Time overestimation | ~43.7 minutes vs. PSG | Garmin classified quiet wakefulness as sleep more than most comparators |
| WASO underestimation | ~49.5 minutes vs. PSG | Worst WASO performance of all seven devices tested |
| Wake-detection specificity | 0.18–0.19 | Lowest of all seven devices; actigraphy achieved 0.39; best-in-class Fitbit achieved 0.54 |
| Sleep sensitivity (detecting sleep correctly) | High (>0.90) | Garmin reliably detects sleep epochs — the problem is false-negative wake detection, not false sleep detection |
| Cohen's kappa (stage agreement) | ~0.54 (Garmin's own study, home EEG reference) | Moderate agreement; full PSG comparison would likely yield lower kappa |
The wake-detection specificity figure of 0.18–0.19 is the most clinically significant finding. Specificity in this context measures how accurately the device identifies wake epochs as wake — a specificity of 0.18 means the device correctly identifies only about 18% of actual wake periods, labeling the remaining 82% as sleep. This is structurally problematic for anyone whose primary sleep complaint involves waking during the night.
Real-World Consistency: A Different Measure
Separate from clinical accuracy, Terra's 2025 analysis of approximately 5,000 nights across multiple wearable platforms examined output consistency — how stable and reproducible a device's readings are night to night within its own framework. On this measure, Garmin performed well: it produced the lowest outlier rate and tightest standard deviation of any platform in the dataset.
Consistency and accuracy are not the same thing. A device can consistently produce the same biased output every night. The Terra data confirms that Garmin's readings are stable and reproducible — which is useful for trend-tracking — but does not contradict the PSG accuracy findings from Chinoy et al.
Where Garmin Excels and Where It Falls Short
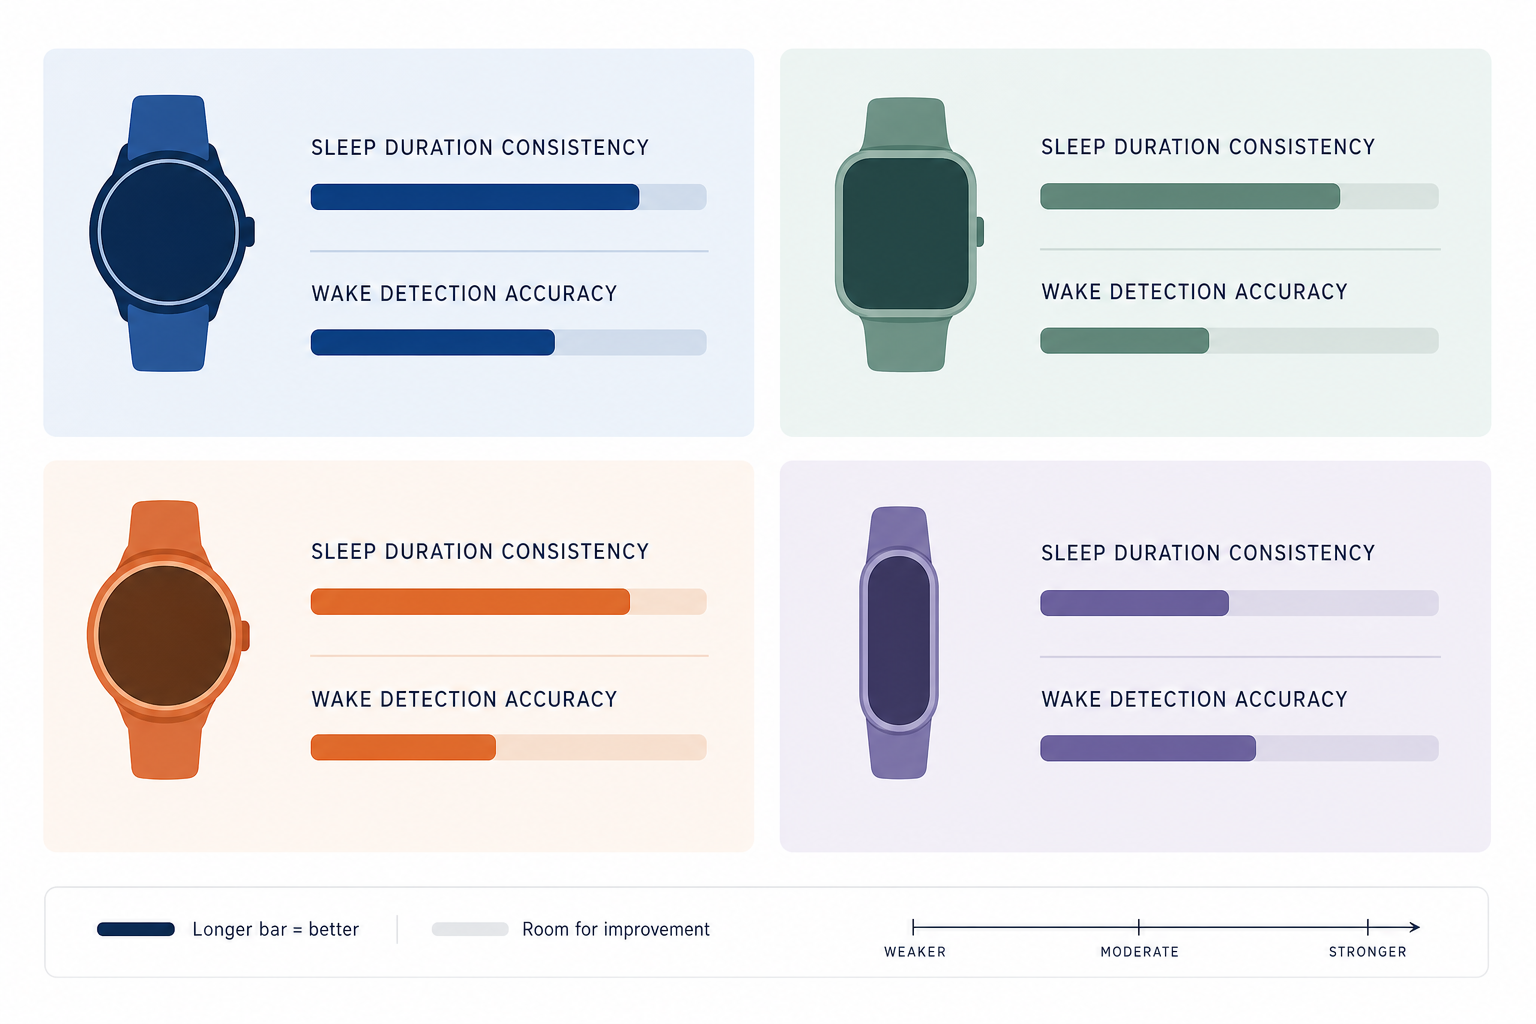
The evidence points to a specific performance profile: Garmin is strong on long-term sleep duration consistency and composite wellness metrics, and weak on nightly wake detection. These strengths and limitations are not equally distributed across users — they matter more or less depending on why someone is tracking sleep.
- Consistent duration tracking across weeks and months — Garmin produces the most stable sleep duration outputs of any major wrist-worn platform, making it reliable for monitoring long-term sleep trends even if individual nightly totals carry a ~40-minute overestimation bias.
- Body Battery and HRV Status as recovery indicators — These composite metrics aggregate multiple signals over time and are more robust than single-metric nightly readouts. The direction of change (recovering vs. depleting) is a meaningful signal for managing training load, stress, and lifestyle factors.
- Broad device ecosystem with no subscription requirement — Garmin's sleep features are fully available without a recurring subscription, across a wide range of devices from basic fitness bands to multisport watches.
- SpO2 and breathing variation screening — Available on compatible devices as a screening-level indicator of potential respiratory disturbance, not a clinical diagnostic but useful as a flag for further evaluation.
- Wake detection is the weakest area — A specificity of 0.18–0.19 means the device misses the large majority of actual wake periods, labeling them as sleep. This is not a minor calibration issue; it fundamentally distorts WASO readings.
- Sleep stage percentages carry high uncertainty — The light/deep/REM breakdown is the most prominent display element but the least reliable output. Epoch-level misclassification is common across all consumer wearables, and Garmin is not an exception.
- Nightly sleep score should not be treated as a clinical verdict — The composite score aggregates uncertain inputs. A single low score does not confirm poor sleep; a high score does not confirm good sleep, particularly for people with sleep-maintenance issues.
- Published PSG validation is limited to older hardware — The most rigorous independent accuracy data applies to the Fenix 5S and Vivosmart 3. Current hardware may perform differently, but independent PSG validation of current models is not yet available in peer-reviewed literature.
Garmin vs. Oura, Fitbit, and Apple Watch: A Comparison
No single device wins across all dimensions of sleep tracking accuracy. The comparison below is metric-dependent: Garmin leads on duration consistency and no-subscription access; Fitbit leads on wake detection in the Chinoy 2021 dataset; Oura leads on overall stage accuracy in multiple independent comparisons. Apple Watch has the least dedicated sleep-science infrastructure of the four.
| Dimension | Garmin | Oura Ring | Fitbit | Apple Watch |
|---|---|---|---|---|
| Sleep stage methodology | PPG + HRV + accelerometer, cloud neural network | PPG + temperature + accelerometer, ring form factor (less motion artifact) | PPG + accelerometer, proprietary algorithm | PPG + accelerometer; sleep stages added in watchOS 9 (2022) |
| Wake-detection specificity (PSG comparison) | 0.18–0.19 (Chinoy 2021, older hardware) | Not directly compared in same study; generally higher in independent tests | 0.54 (Chinoy 2021, best in class) | Limited independent PSG data; generally similar to Garmin range |
| TST accuracy vs. PSG | Overestimates ~43.7 min | Overestimates ~27 min in comparable studies | Overestimates ~20–30 min | Overestimates; less studied vs. PSG |
| Duration consistency (real-world) | Highest consistency, lowest outlier rate (Terra 2025) | High consistency | Moderate-to-high | Moderate |
| Subscription required | No | Yes (~$5.99/month or $69.99/year for full features) | No (Fitbit Premium optional) | No |
| Form factor | Wrist (smartwatch or fitness band) | Finger ring | Wrist (fitness band or smartwatch) | Wrist (smartwatch) |
| Ideal user profile | Fitness-primary users who also want sleep trends; no-subscription preference | Sleep-focused tracker; non-wrist preference; willing to pay subscription | Users prioritizing wake-detection accuracy; Fitbit ecosystem users | Apple ecosystem users; general wellness tracking |
How to Use Garmin Sleep Data Without Overtrusting It
The most useful reframe for Garmin sleep data is to treat different outputs as having different time horizons and different levels of confidence. Some metrics are worth acting on; others are worth noting; others are worth largely ignoring on a nightly basis.
- Act on: weekly and monthly duration trends. If your average reported sleep drops from 7.5 to 6.5 hours over three weeks, that directional signal is reliable even with the overestimation bias. Consistent decline warrants attention.
- Act on: Body Battery direction over multiple days. If Body Battery consistently fails to recover overnight across a week, that pattern reflects real physiological stress or sleep disruption, regardless of what the nightly sleep score says.
- Act on: HRV Status baseline deviation over weeks. A sustained drop in HRV below your personal baseline correlates with increased physiological load. The specific nightly number matters less than the multi-week trajectory.
- Treat as directional: sleep stage percentages. A consistent pattern of very low reported deep sleep across weeks may reflect a real signal, but a single night showing 5% deep sleep does not confirm a problem. Stage percentages are noisy at the epoch level.
- Weight lightly without corroborating symptoms: nightly WASO and single-night sleep score. If the app shows minimal wake time but you remember waking frequently, trust your subjective experience. If the sleep score is low but you feel rested, the score is not the more reliable signal.
The Orthosomnia Risk: When Sleep Tracking Worsens Sleep
There is a documented clinical phenomenon in which preoccupation with sleep tracker data actively disrupts sleep. The term orthosomnia — coined to describe sleep disturbance driven by efforts to achieve perfect tracker readings — reflects a pattern that sleep clinicians began observing as consumer wearables became mainstream.
Research published in the Journal of Clinical Sleep Medicine by Ellis and Booth in 2023 documented the orthosomnia phenomenon formally, confirming that tracker-related anxiety can become a maintaining factor in insomnia rather than a tool for resolving it. The mechanism is straightforward: checking a sleep score the moment you wake up activates performance anxiety about sleep, which is one of the core cognitive patterns that perpetuates insomnia.
People with existing insomnia face the greatest risk from this dynamic. If you already struggle with sleep and you check your Garmin score every morning, you are introducing a nightly evaluation that your nervous system will begin to anticipate. A low score triggers anxiety; a high score provides only temporary reassurance before the next night's evaluation begins.
The more constructive use of Garmin sleep data for people with sleep difficulties is as a background trend monitor rather than a nightly report card. Tracking whether your sleep duration is stable across a month, or whether your Body Battery is recovering after lifestyle changes, provides information that supports decisions without creating a nightly performance loop.
This is not an argument against using sleep tracking. It is an argument for using it in a way that is consistent with what the data can actually tell you — and with what your sleep needs from you, which is less monitoring and more trust in the body's own capacity to sleep when the conditions support it.
Supports these guides
Spot an error or have clinical feedback?
Because this article covers clinical, medication, or safety information, we use a moderated correction channel instead of open public comments. Let us know if something about “Garmin Sleep Tracking: Accuracy, Metrics, and How It Compares” needs a closer look.
Send feedback on this article