Mechanism explainer
Oura Ring Sleep Tracking Accuracy and Features: What the Research Actually Shows
A research-anchored review of the Oura Ring Gen 4 for adults evaluating whether the device is worth buying or trusting — covering validated accuracy figures, how each feature works, where the data is reliable, and where it falls short, particularly for people with sleep disorders.
Device Overview: Specs, Price, and Subscription
The Oura Ring Gen 4 is a finger-worn sleep and health tracker available in titanium and ceramic finishes, sized 4 through 15. It retails between $349 and $499 depending on finish, and requires a $5.99 per month subscription after the first included month to access the full feature set. Without an active subscription, only daily summary scores remain visible — the underlying sleep stage data, HRV trends, and detailed readiness breakdown are locked behind the paywall.
| Specification | Oura Ring Gen 4 |
|---|---|
| Form factor | Finger ring |
| Materials | Titanium (all finishes); ceramic option available |
| Sizes | 4–15 |
| Price | $349–$499 |
| Subscription | $5.99/month (required for full data access) |
| Battery life | Up to 8 days |
| Sensors | Infrared PPG, NTC temperature, 3D accelerometer, SpO2 |
| Water resistance | 100m water resistant |
The Gen 4 introduced meaningful hardware changes over the Gen 3: a fully titanium construction (the Gen 3 used partial plastic), recessed flush Smart Sensing LEDs (the Gen 3 had raised sensor bumps on the inner band), and an extended 8-day battery. The sensor array also gained additional LEDs to improve signal quality.
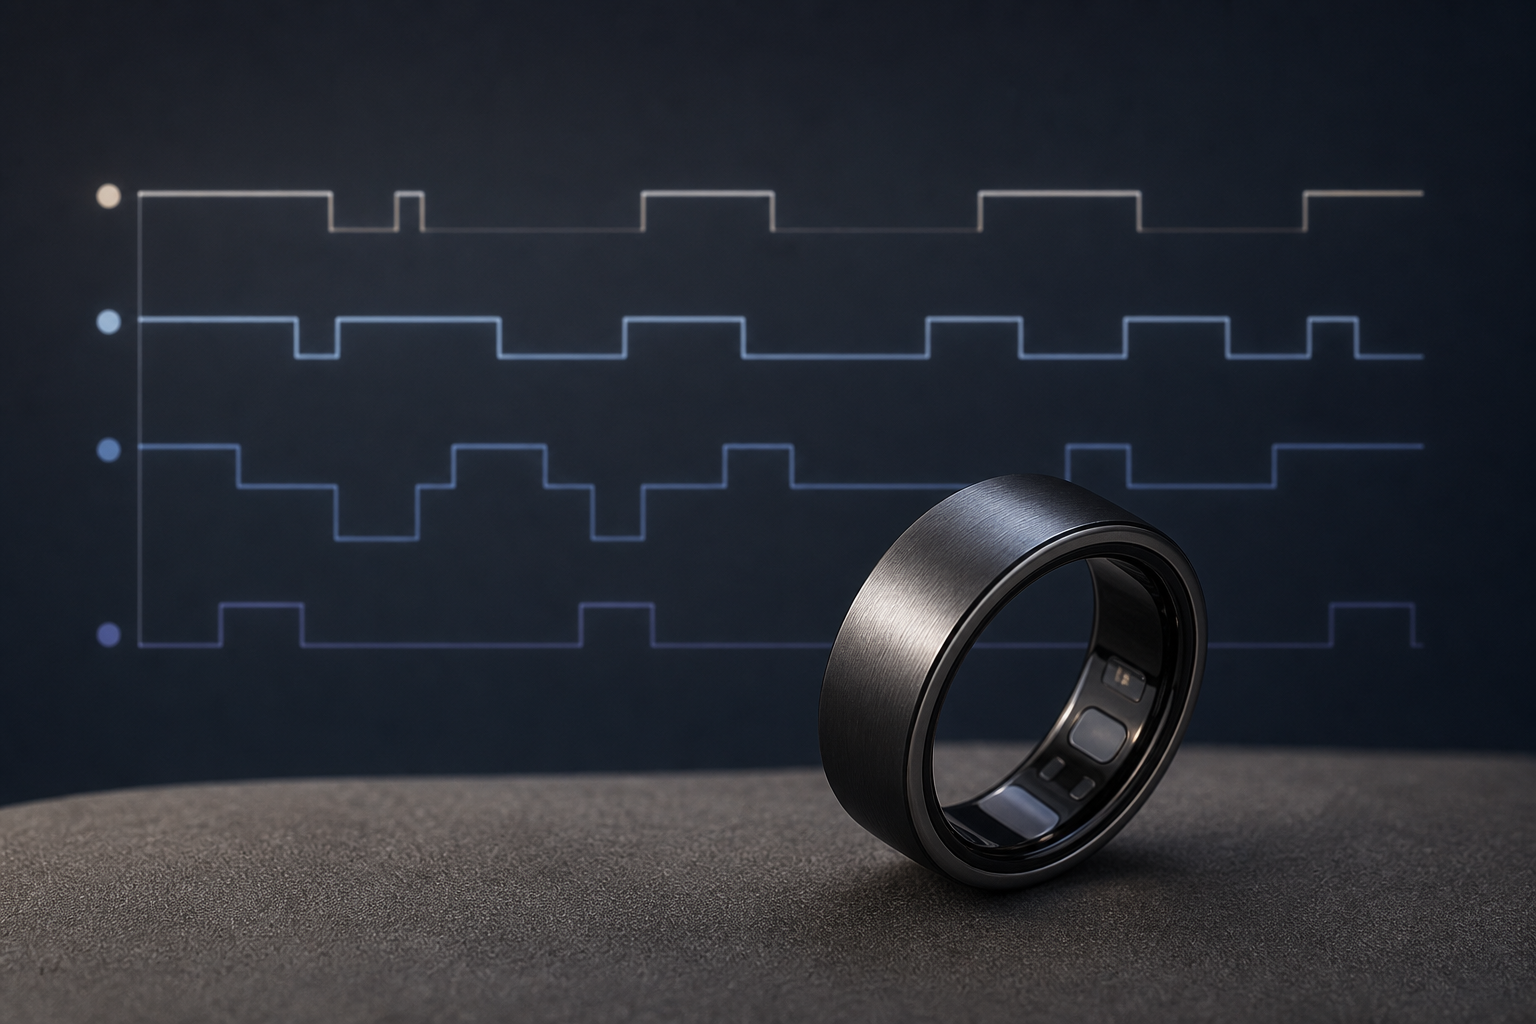
How the Oura Ring Works: Sensor Stack Explained
The ring uses four core sensing systems to build its sleep picture: an infrared photoplethysmography (PPG) sensor, a negative temperature coefficient (NTC) thermistor, a 3D accelerometer, and a pulse oximeter for SpO2 estimation.
The PPG sensor is the most important of these. It shines infrared light into the finger and measures the variation in light absorption as blood pulses through the digital arteries. From this signal, the device derives heart rate, heart rate variability (HRV), and blood volume pulse patterns — all of which feed the sleep staging algorithm.
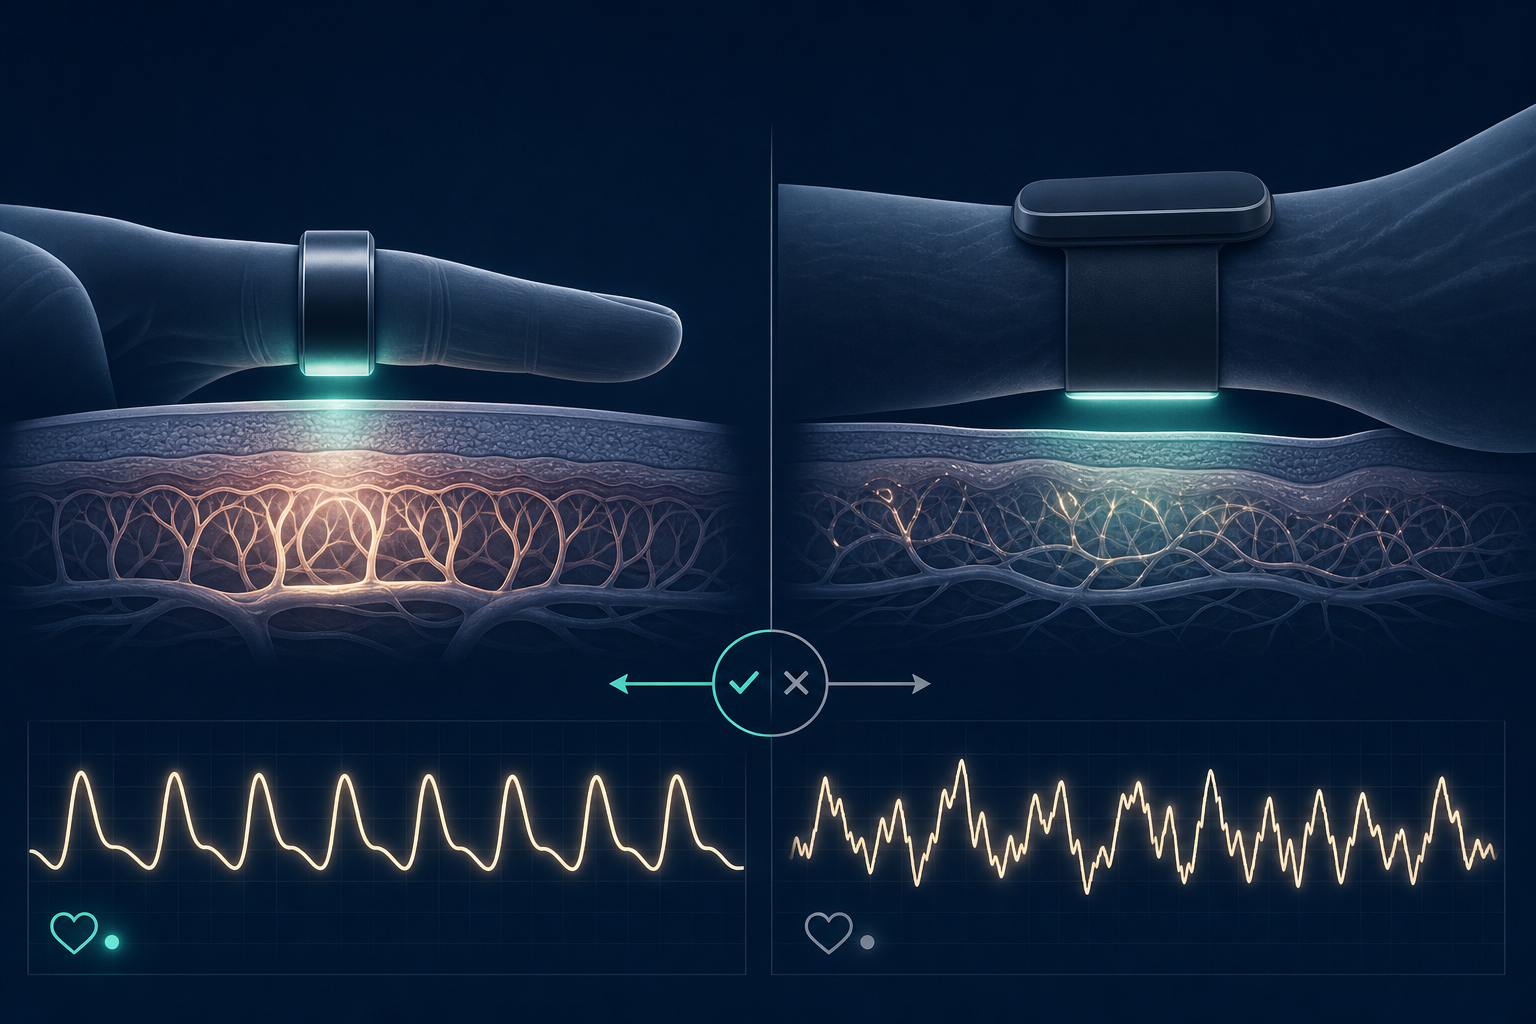
Finger placement confers a measurable physiological advantage over wrist-worn devices. The digital arteries in the finger sit closer to the skin surface than the radial artery at the wrist, and the finger moves substantially less during sleep than the wrist. Both factors reduce motion artifact — the noise that degrades wrist-worn PPG signals and contributes to misclassification of sleep stages. This structural advantage is part of why Oura has consistently outperformed wrist-worn competitors in head-to-head sleep staging comparisons.
The NTC temperature sensor measures skin temperature at the finger throughout the night. Rather than reporting absolute temperature, the ring tracks deviation from your individual baseline — a signal used in the Readiness Score and, separately, in Oura's cycle tracking feature. The 3D accelerometer captures body movement and position, contributing to sleep/wake detection and distinguishing restless from still sleep periods.
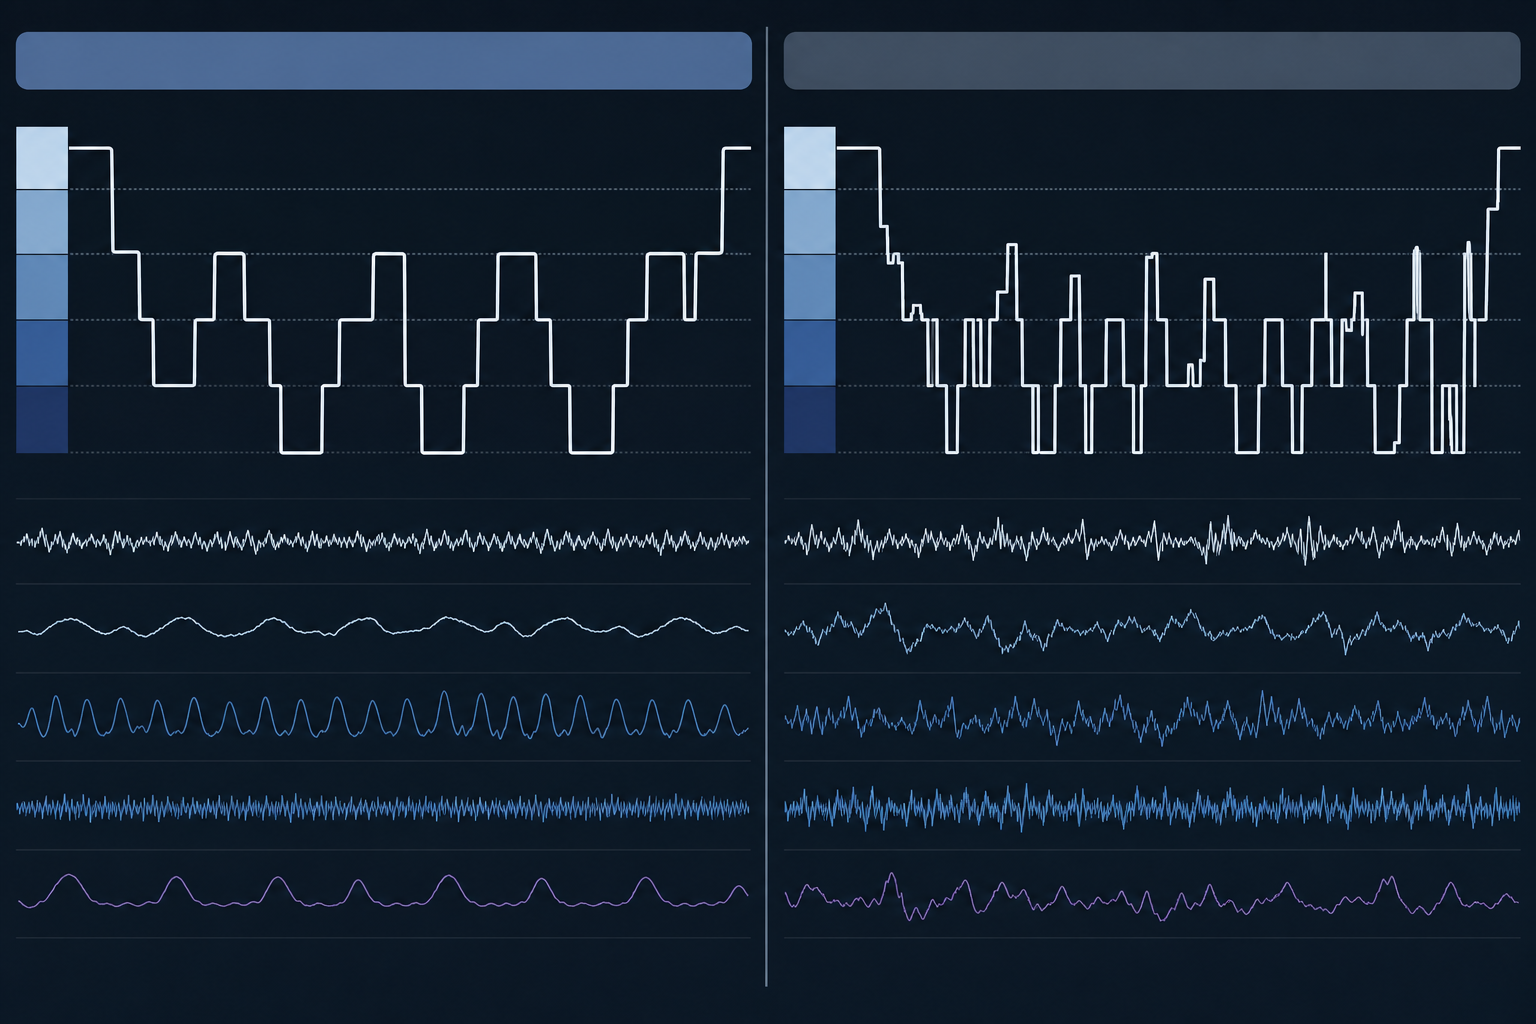
Sleep staging combines all three streams — HRV patterns, temperature deviation, and movement data — through a proprietary machine learning algorithm. The algorithm classifies each 30-second epoch of the night into one of four states: wake, light sleep, deep sleep, or REM. This is the same four-stage structure used in clinical polysomnography (PSG), though the methods for arriving at that classification differ fundamentally: PSG uses electroencephalography (EEG) to directly measure brain electrical activity, while the Oura Ring infers sleep stage from autonomic and movement signals.
What the Oura Ring Tracks: Sleep Metrics Mapped to PSG Equivalents
Understanding what the Oura Ring's dashboard labels actually represent — and what they are attempting to approximate — is essential for interpreting the accuracy data that follows.
| Oura Ring Label | PSG Equivalent | What It Represents |
|---|---|---|
| Light Sleep | N1 + N2 (NREM stages 1 and 2) | Lighter non-REM sleep; transition and sustained light sleep combined into one category |
| Deep Sleep | N3 (slow-wave sleep) | The deepest, most restorative NREM stage; characterized by delta brain waves in PSG |
| REM Sleep | REM | Rapid eye movement sleep; associated with dreaming and memory consolidation |
| Awake | Wake (W) | Periods of wakefulness during the sleep period |
| Total Sleep Time (TST) | TST | Total minutes scored as any sleep stage |
| Sleep Efficiency (SE) | SE | Percentage of time in bed spent asleep |
| Wake After Sleep Onset (WASO) | WASO | Total wake time after initial sleep onset |
| Sleep Onset Latency (SOL) | SOL | Time from lights-out to first sleep epoch |
The Sleep Score is a composite 0–100 index calculated from multiple inputs including total sleep time, sleep efficiency, sleep stage distribution, restfulness, and timing relative to your circadian window. Oura uses three interpretive bands: 85–100 is considered optimal, 70–84 is good, and below 70 signals a night that needs attention.
The Readiness Score is distinct from the Sleep Score and is frequently misunderstood. It is not a direct physiological measurement of any single biomarker. It is a composite algorithm that integrates overnight HRV, resting heart rate, body temperature deviation from baseline, prior day's activity load, sleep quality metrics, and recovery index. A high Readiness Score indicates that multiple physiological signals are trending in a favorable direction relative to your personal baseline — it does not mean any single metric is clinically optimal.
Accuracy in Healthy Adults: What Peer-Reviewed Studies Show
The strongest body of evidence on Oura Ring accuracy comes from studies conducted in healthy adults without sleep disorders. The findings are genuinely encouraging for this population — with important caveats about what the numbers actually mean at the individual level.
The 2025 Meta-Analysis: Group-Level Agreement with PSG
A 2025 systematic review and meta-analysis by Khan et al., published in PMC, pooled data from 6 studies involving 388 participants and found no statistically significant difference between the Oura Ring and PSG or actigraphy reference standards for any of the primary sleep metrics in healthy adults.
| Sleep Metric | Mean Difference vs. PSG | Statistical Significance |
|---|---|---|
| Total Sleep Time (TST) | −2.97 minutes | Not significant (p=0.42) |
| Sleep Efficiency (SE) | −1.32% | Not significant (p=0.07) |
| Wake After Sleep Onset (WASO) | +1.64 minutes | Not significant (p=0.82) |
| Sleep Onset Latency (SOL) | +0.48 minutes | Not significant (p=0.78) |
| Light Sleep Time | −4.27 minutes | Not significant (p=0.68) |
| Deep Sleep Time | +1.39 minutes | Not significant (p=0.82) |
| REM Sleep Time | −3.89 minutes | Not significant (p=0.57) |
These are meaningful results. Across all major sleep parameters, the Oura Ring's group-level estimates were statistically indistinguishable from laboratory sleep studies in healthy adults. The meta-analysis authors note, however, that all included studies evaluated generally healthy participants — five of the six explicitly confirmed the absence of sleep disorders — which limits how far these findings can be generalized.
The Robbins/BWH 2024 Study: Stage Sensitivity and a Critical Nuance
A 2024 study from Brigham and Women's Hospital, published in the journal Sensors, tested the Oura Ring Gen 3 alongside Fitbit and Apple Watch against simultaneous PSG in 35 healthy adults aged 20–50. The Oura Ring demonstrated the strongest four-stage sleep classification performance of the three devices:
- Light sleep sensitivity: 78.2%
- Deep sleep sensitivity: 79.5%
- REM sleep sensitivity: 76.0%
- Overall Cohen's kappa: 0.65 (vs. Fitbit 0.55, Apple Watch 0.60)
The ring did not significantly over- or underestimate any sleep stage at the group level — with one exception: it significantly overestimated sleep onset latency by approximately 5 minutes (p<0.001). This SOL bias was small in absolute terms but was statistically consistent, suggesting a systematic tendency to count the early transition period as sleep before the algorithm locks onto sleep onset.
Here is where the Robbins 2024 data contains a critical nuance that is frequently overlooked in summaries of the study. Despite the non-significant group-mean differences, the intraclass correlation coefficients (ICC) — a measure of agreement at the individual level — were poor for the two most clinically interesting sleep stages:
- ICC for deep sleep: 0.32 (poor)
- ICC for REM sleep: 0.27 (poor)
What this means in practice: when the ring says you got 90 minutes of deep sleep on a given night, the actual amount could differ substantially from what PSG would have measured for you specifically — even though across a group of people, the average error is small. Group-level agreement and individual-level reliability are different things, and for personal health decisions, individual reliability is what matters.
For historical context: a 2019 study by de Zambotti et al. tested the original Oura Ring algorithm and found sleep stage agreement of 51–65% — substantially lower than the 76–79.5% range seen in the Gen 3 OSSA 2.0 studies. The improvement over successive algorithm generations is real and meaningful.
Accuracy in Clinical Populations: The Evidence That Changes the Picture
The healthy-adult accuracy data paints a favorable picture. But for readers who have — or suspect they have — a sleep disorder, a 2025 study published in Scientific Reports by Herberger and colleagues at Charité University Medicine Berlin provides the most important counterpoint in the literature.
The Charité study tested the Oura Ring in a university sleep lab cohort of 45 patients with diverse sleep disorders — including obstructive sleep apnea (OSA), insomnia disorder, restless legs syndrome, narcolepsy, and hypersomnia. These are not edge cases; they represent the populations most likely to be considering a sleep tracker to understand their sleep problems.
In this population, the Oura Ring achieved only 53.18% four-stage sleep staging accuracy (Cohen's kappa = 0.31) — substantially lower than the 76–79.5% sensitivity seen in healthy adults. Binary sleep/wake detection held up better at approximately 85%, but wake sensitivity was only 46.19%, meaning the ring frequently classified wakefulness as light sleep.
The group-level TST differences remained below 12 minutes on average — a figure that might appear reassuring. But the Charité authors make a critical methodological point: those average differences mask large individual-level errors characterized by proportional bias. For individual patients, the ring's estimates could diverge substantially from PSG in ways that are not correctable by simple calibration.
"While some devices may demonstrate reasonable agreement with PSG on average, this agreement masks substantial individual-level inaccuracies, prohibiting their use in clinical sleep medicine."
— Herberger et al., Scientific Reports, 2025 (Charité University Medicine Berlin). Study declared no competing interests.
The contrast between the two bodies of evidence is significant. The healthy-adult studies (Robbins 2024, Khan 2025 meta-analysis) were funded by or conducted with involvement from Oura Ring Inc. and tested people without sleep disorders. The Charité study was independently funded, declared no competing interests, and tested people with the conditions most relevant to readers seeking clinical insight from their sleep data.
HRV, Temperature, and SpO2: Feature-by-Feature Evidence
Heart Rate Variability: What the Ring Gets Right and Wrong
A 2022 study by Cao et al., published in PMC, assessed the Oura Ring's HRV accuracy against simultaneous electrocardiography (ECG) in 35 healthy adults monitored at home overnight. The results were nuanced and practically important.
- Nocturnal heart rate: Highly accurate (Pearson r = 0.993 vs. ECG)
- RMSSD (the primary HRV metric the dashboard reports): Accurate (r = 0.915 vs. ECG)
- AVNN, pNN50, HF, SDNN per-night averages: Acceptable accuracy
- LF power and LF:HF ratio: Unreliable — high error rates in both short-term and overnight analyses
The practical implication: the metrics the Oura dashboard surfaces directly — heart rate and RMSSD — are the reliable ones. LF power and the LF:HF ratio, which some users calculate from raw interbeat interval (IBI) data exported from the ring, are not reliable outputs from this device. If you are using the ring's HRV data, stick to what the dashboard shows you directly.
Temperature Trend
The ring's temperature sensor reports deviation from your personal baseline rather than absolute skin temperature. This deviation signal feeds into both the Readiness Score and Oura's menstrual cycle tracking feature, where a sustained temperature rise signals post-ovulation. As a trend signal — flagging nights when your temperature is running notably above or below your norm — it has practical utility for detecting early illness or physiological stress.
Independent peer-reviewed studies specifically validating the Oura Ring's temperature accuracy against a clinical reference standard were not available in the published literature as of June 2026. The temperature feature should be understood as a relative trend signal, not a calibrated thermometric measurement.
SpO2
The Oura Ring Gen 4 includes a pulse oximeter that estimates blood oxygen saturation (SpO2) during sleep. This feature is presented as a supplemental metric, and that framing should be taken at face value. The ring is not FDA-cleared as a medical-grade SpO2 monitoring device. It cannot diagnose obstructive sleep apnea or any other breathing disorder. A low or variable SpO2 reading from the ring is a reason to discuss your sleep with a clinician, not a diagnostic conclusion.
Known Limitations and Accuracy Caveats
Even in the most favorable testing conditions — healthy adults, controlled lab setting, experienced users — the Oura Ring carries specific, documented limitations that apply to how its data should be interpreted.
- Sleep onset latency overestimation: The ring systematically overestimates SOL by approximately 5 minutes even in healthy adults (Robbins 2024, p<0.001). This is a statistically significant bias, not random noise.
- Poor individual-level reliability for deep sleep and REM: Despite non-significant group-mean differences, ICC for deep sleep was 0.32 and for REM 0.27 — both in the poor range. On any given night, your personal deep sleep or REM estimate may differ substantially from what PSG would show.
- Population generalizability: All strong healthy-adult validation studies enrolled participants without sleep disorders, mostly aged 20–50. Accuracy in older adults, people with comorbidities, and people with sleep disorders has not been confirmed by the same evidence base — and the Charité 2025 data actively contradicts extrapolation to clinical populations.
- Skin tone coverage gap: The Robbins 2024 study included Fitzpatrick skin types 1–5, but only 14% of participants were Type 5 and no Type 6 participants were enrolled. PPG accuracy for the darkest skin tones remains unconfirmed for the Oura Ring, even though finger placement is more favorable than wrist placement.
- Low-movement wakefulness misclassification: Real-world testing has shown that sedentary wakefulness — sitting still in a chair, for example — can be logged as sleep. This is consistent with the Charité study's finding that wake sensitivity was only 46.19% in clinical patients, many of whom have disturbed and fragmented sleep with frequent brief awakenings.
- Gen 4 validation gap: No independent peer-reviewed Gen 4-specific sleep staging study had been published as of June 2026. All accuracy figures in this article are derived from Gen 3 research.
The distinction between group-mean accuracy and individual reliability deserves emphasis because it is the most common source of misinterpretation. When a study reports that the Oura Ring's TST estimate was not significantly different from PSG across 388 participants, it means the errors largely cancelled out across the group. It does not mean the ring was accurate for every individual in that group. For personal health decisions — adjusting your sleep schedule, worrying about your deep sleep percentage, deciding whether to see a doctor — individual reliability is the relevant standard, and the ICC data shows that individual reliability for sleep stages is poor.
Orthosomnia: When Sleep Tracking Makes Sleep Worse
Orthosomnia is a clinically documented phenomenon: anxiety, preoccupation, and sleep disruption driven by excessive focus on sleep tracker data. It has been described in the sleep medicine literature as a risk particularly relevant to people who already have insomnia or health anxiety.
The mechanism is straightforward. Sleep trackers produce data that is, as this article documents, approximate and subject to individual-level error. When a person with pre-existing sleep anxiety receives a low Sleep Score or a low deep sleep percentage, they may interpret it as confirmation that something is wrong — even when the reading reflects measurement noise rather than a genuine physiological deficit. That interpretation generates cognitive arousal and worry, which are themselves primary drivers of insomnia. The tracking intended to help understand sleep ends up worsening the condition it was meant to illuminate.
This is not a theoretical concern. Clinicians treating insomnia have reported patients presenting with worsened sleep and heightened anxiety specifically attributable to sleep tracker use. The Oura Ring's scores are generated by an algorithm that, in clinical populations, correctly classifies sleep stages only about half the time. Building behavioral or emotional responses around that data — particularly for people with existing sleep vulnerability — carries real risk.
Who Benefits Most — and Who Should Be Cautious
The Oura Ring is not the right device for every person interested in sleep. The evidence supports a clear distinction between the populations it serves well and those for whom it may be unsuitable or actively counterproductive.
Readers Who Get the Most Value
- Wellness-oriented adults without sleep disorders who want longitudinal trends in total sleep time, sleep efficiency, and HRV over weeks and months. The group-level accuracy in healthy adults is strong, and trends over time are more meaningful than any single night's reading.
- People who prefer not to wear a device on their wrist for sleep tracking — the ring form factor is unobtrusive and the finger-based PPG provides a physiological accuracy advantage over wrist-worn alternatives.
- People who want consolidated sleep and activity data in one device and are comfortable with a subscription model.
- People interested in menstrual cycle tracking or illness detection via the temperature deviation signal, used as a directional indicator rather than a clinical measurement.
Readers Who Should Be Cautious
- People with diagnosed or suspected insomnia disorder, sleep apnea, restless legs syndrome, narcolepsy, or other sleep disorders. The Charité 2025 data shows that sleep stage accuracy drops to approximately 53% in this population. The ring's data may be misleading rather than informative, and the orthosomnia risk is elevated.
- People prone to health anxiety or score fixation. If you are likely to check your Sleep Score or Readiness Score daily and feel anxious about low readings, the device may worsen rather than improve your relationship with sleep.
- Anyone seeking a diagnostic tool for a sleep condition. The Oura Ring is not FDA-cleared as a diagnostic device. It cannot diagnose insomnia disorder, obstructive sleep apnea, or any other sleep pathology. If you have symptoms suggesting a sleep disorder, a clinical evaluation — not a consumer ring — is the appropriate first step.
- Older adults and those with significant comorbidities. The validation literature is based primarily on healthy adults aged 20–50. Accuracy in older adults has not been confirmed by the same evidence base.
Summary: What the Oura Ring Measures Well, Approximately, and Not Reliably
The table below consolidates the evidence-based conclusions across three accuracy tiers. It is a reference for what the device can and cannot be reasonably trusted to deliver, based on the peer-reviewed literature available as of June 2026.
| Accuracy Tier | Metric or Feature | Evidence Basis |
|---|---|---|
| Measures well | Total sleep time (group level, healthy adults) | Khan 2025 meta-analysis; Robbins 2024 |
| Measures well | Sleep efficiency (group level, healthy adults) | Khan 2025 meta-analysis |
| Measures well | WASO (group level, healthy adults) | Khan 2025 meta-analysis |
| Measures well | Nocturnal heart rate | Cao et al. 2022 (r=0.993 vs. ECG) |
| Measures well | RMSSD (HRV) | Cao et al. 2022 (r=0.915 vs. ECG) |
| Measures approximately | Sleep stages in healthy adults (76–79.5% sensitivity) | Robbins 2024; poor individual ICC for deep and REM |
| Measures approximately | Sleep onset latency (with ~5-min overestimation bias) | Robbins 2024 (statistically significant bias) |
| Measures approximately | Readiness Score as a composite physiological trend | Composite algorithm; not a single direct biomarker |
| Measures approximately | Temperature deviation from personal baseline | No independent peer-reviewed validation; directional signal only |
| Not reliably | Sleep stages in clinical populations with sleep disorders | Herberger 2025: 53.18% four-stage accuracy (Kappa=0.31) |
| Not reliably | Individual-level deep sleep and REM estimates | Robbins 2024: ICC 0.32 (deep), 0.27 (REM) |
| Not reliably | LF power and LF:HF HRV ratio | Cao et al. 2022: high error rates |
| Not reliably | SpO2 for diagnostic use | Not FDA-cleared; supplemental metric only |
| Not reliably | Sleep apnea detection | Not FDA-cleared; cannot diagnose breathing disorders |
The Oura Ring is the best-validated consumer sleep tracker for the metrics it measures well. That validation is real, and it comes from a meaningful body of peer-reviewed research. But the research also reveals a consistent pattern: accuracy is strongest at the group level in healthy adults, weakest at the individual level and in people with sleep disorders. Using the device as a longitudinal wellness tool — tracking trends over weeks, not reacting to individual nights — aligns with what the evidence actually supports.
Supports these guides
Spot an error or have clinical feedback?
Because this article covers clinical, medication, or safety information, we use a moderated correction channel instead of open public comments. Let us know if something about “Oura Ring Sleep Tracking Accuracy and Features: What the Research Actually Shows” needs a closer look.
Send feedback on this article