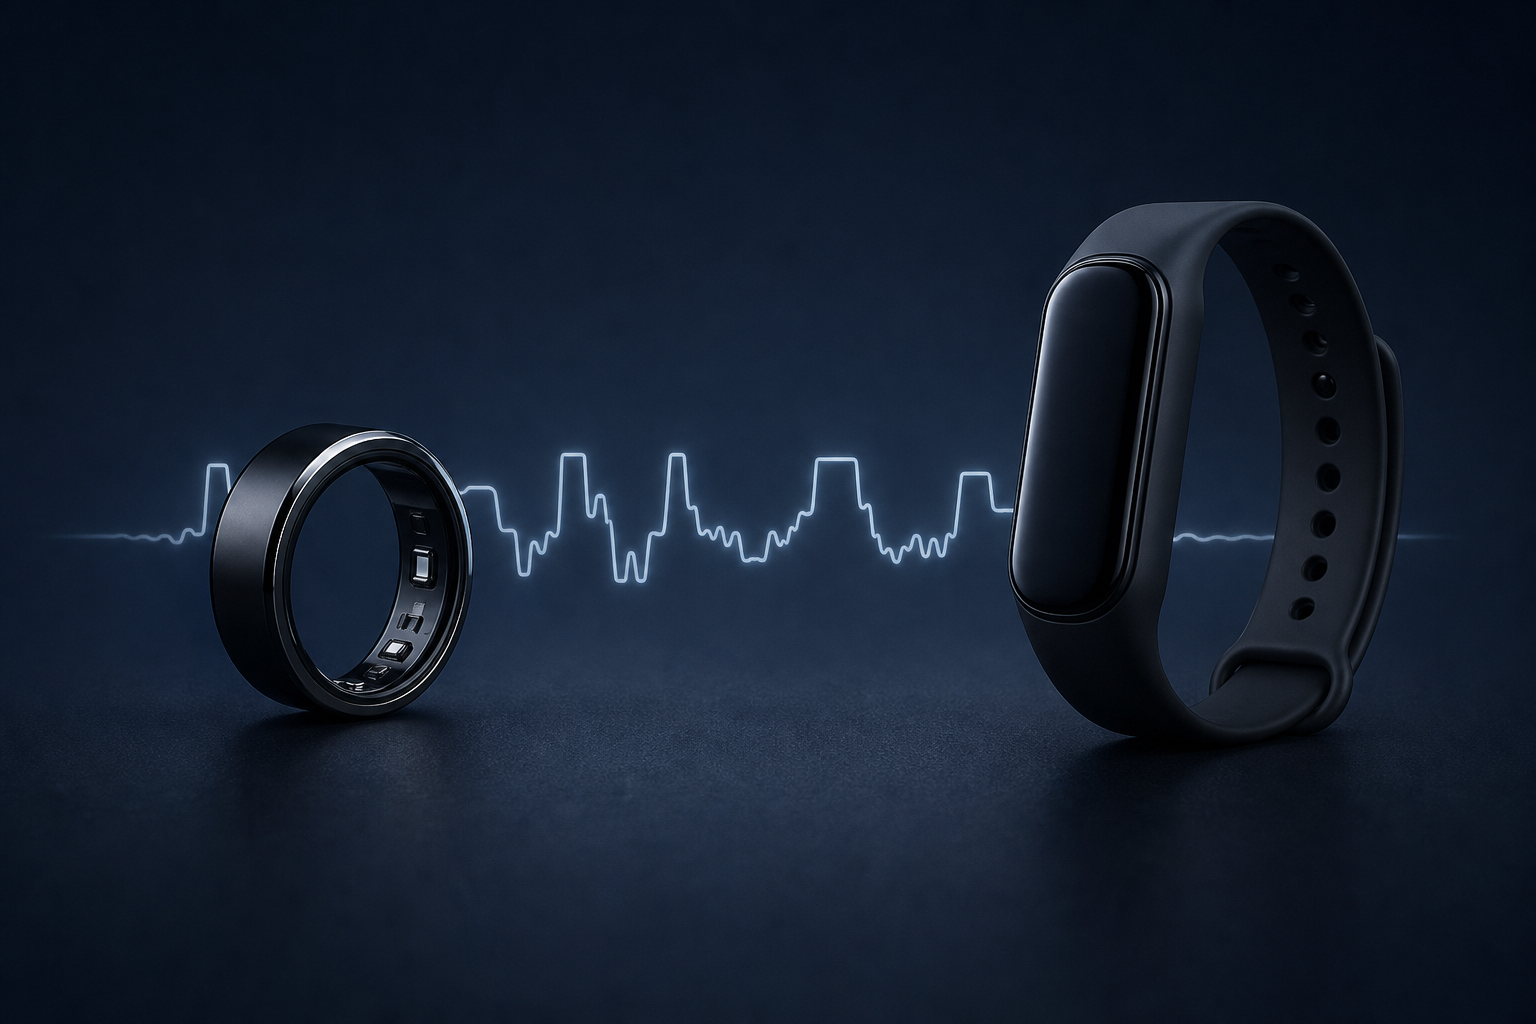
Mechanism explainer
Oura Ring vs. WHOOP for Sleep Tracking: What the PSG Validation Evidence Actually Shows
A evidence-first comparison of Oura Ring and WHOOP for adults deciding between the two devices for sleep tracking — covering published PSG validation study findings, sensor technology differences, scoring system distinctions, total cost of ownership, and the shared accuracy limitations both devices carry.
Why This Comparison Is Different
Most Oura Ring vs. WHOOP articles are organized around features: which app looks better, which band is more comfortable, which device a particular writer preferred after wearing both for two weeks. That structure is not useful if you want to know which device more accurately tracks your sleep.
This article is organized around published polysomnography (PSG) validation evidence — the peer-reviewed studies that compared each device's output against a clinical sleep laboratory reference. That is a different question than which device feels better on your wrist, and it produces different conclusions.
A few things to hold in mind before reading further. Consumer wearables are not clinical devices. Neither Oura Ring nor WHOOP is FDA-cleared as a medical device for sleep staging. Both are consumer wellness products that use optical sensors and machine-learning algorithms to estimate sleep stages — and the gap between "estimate" and "measure" matters more than most product reviews acknowledge.
How Each Device Measures Sleep
Both devices use photoplethysmography (PPG) — optical sensors that detect blood volume changes in tissue — as their primary physiological signal. From PPG data, each device derives heart rate, heart rate variability (HRV), and respiratory rate. These signals, combined with accelerometer data, feed into proprietary machine-learning algorithms that classify each epoch of the night into sleep stages.
The critical difference is where the PPG sensor sits. Oura Ring uses finger-based PPG. WHOOP uses wrist-based PPG. The physiological implications of that placement difference are covered in the next section.
| Oura Ring (Gen3 / Ring 4) | WHOOP 5.0 | |
|---|---|---|
| Sensor location | Finger (inner surface of ring) | Wrist (underside of band) |
| PPG wavelengths | Green and infrared LED | Green LED with photoreceptor |
| Additional sensors | Accelerometer, skin temperature, gyroscope | Accelerometer, skin temperature, gyroscope |
| Derived signals | Heart rate, HRV, SpO2, respiratory rate, body temperature deviation | Heart rate, HRV, SpO2, respiratory rate |
| Sleep staging method | Proprietary ML algorithm (OSSA 2.0 for Gen3) | Proprietary ML algorithm (undisclosed version) |
| Algorithm transparency | Undisclosed; cannot be independently audited | Undisclosed; cannot be independently audited |
| Form factor | Ring | Wrist band |
Why Sensor Placement Matters: Finger vs. Wrist PPG
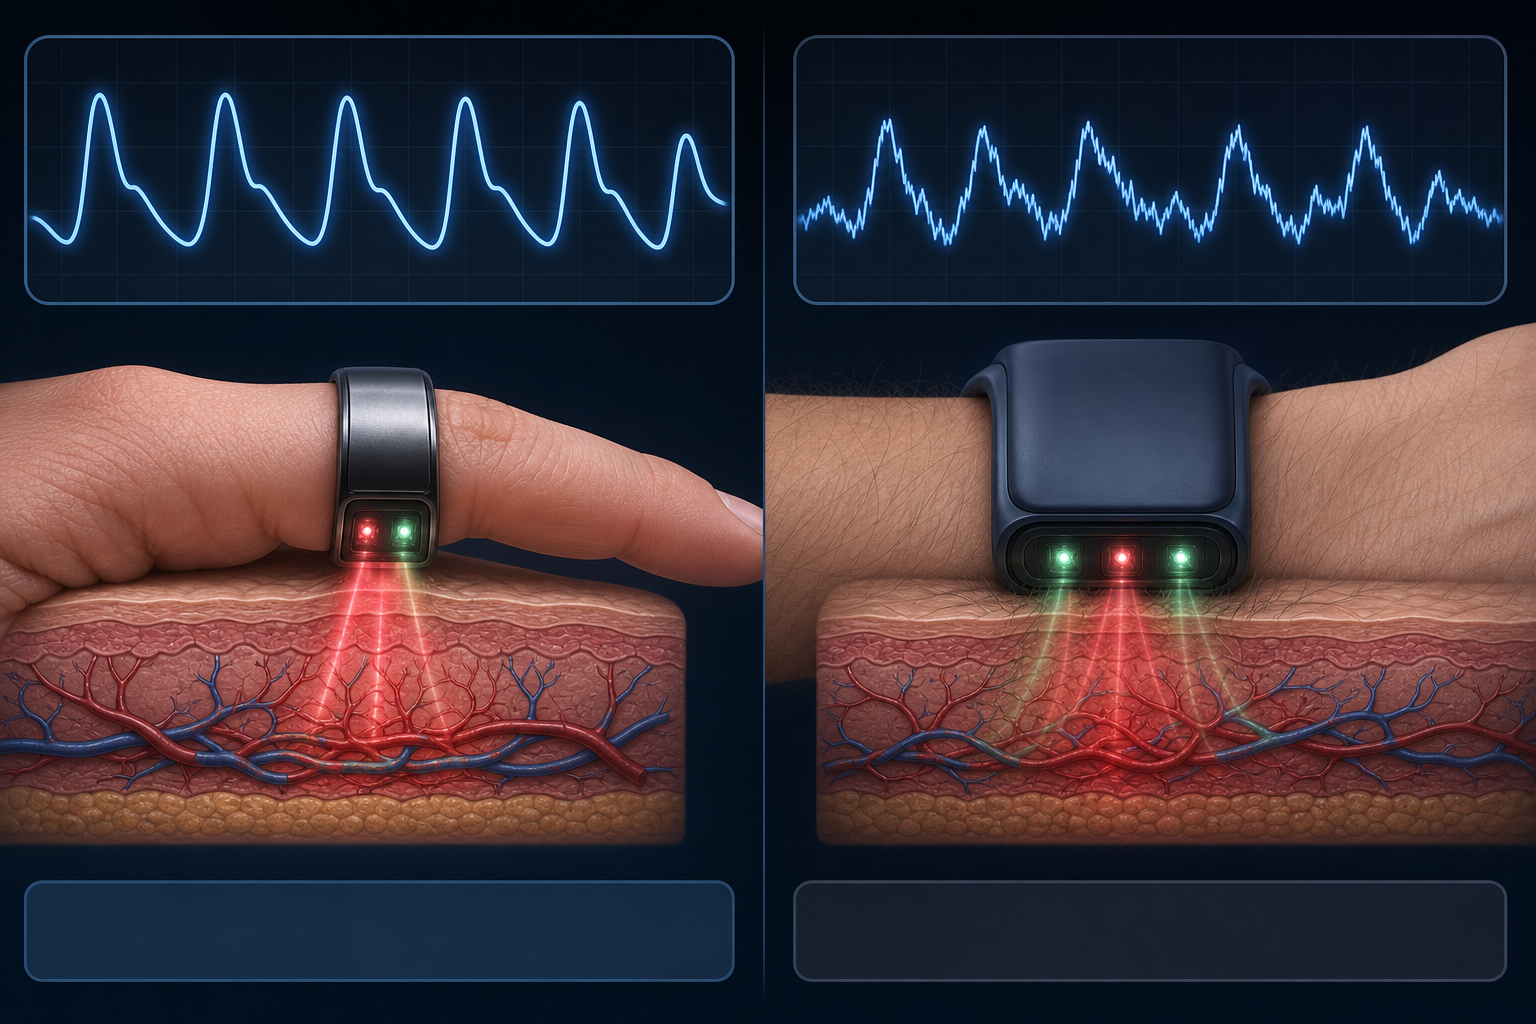
The finger has a higher density of superficial blood vessels and capillaries than the wrist, which produces a stronger and more consistent PPG signal. During sleep, even small movements — rolling over, adjusting position — can introduce motion artifact into a wrist-based sensor, because the wrist sits over tendons and muscle that shift with movement. The finger, enclosed by a ring that maintains consistent contact with the skin, is less susceptible to this problem.
This is not a minor technical footnote. Sleep staging algorithms depend on the quality of the underlying PPG signal to derive accurate HRV and respiratory rate estimates. A noisier signal at the input propagates into less reliable stage classifications at the output. The accuracy differences visible in the PSG validation studies reflect, at least in part, this fundamental signal-quality difference.
That said, sensor placement is not the only variable. Algorithm design, training data, and the specific sleep stages being classified all contribute to accuracy differences. The physiological advantage of finger placement is a contributing factor, not a complete explanation.
What PSG Validation Means and Why It Is the Benchmark
Polysomnography is the clinical gold standard for measuring sleep. A full PSG records brain electrical activity (EEG), eye movements (EOG), muscle tone (EMG), cardiac rhythm (ECG), and respiratory effort simultaneously. Trained sleep technologists score each 30-second epoch of the recording according to standardized AASM criteria, classifying it as wake, N1 (light sleep), N2 (light sleep), N3 (deep sleep/slow-wave sleep), or REM sleep.
When researchers validate a consumer wearable against PSG, they have participants wear the device simultaneously with full PSG equipment in a sleep laboratory (or in some studies, at home with portable PSG). They then compare the device's epoch-by-epoch classifications against the PSG reference.
Several metrics appear in the validation literature and are referenced throughout this article:
- Sensitivity (recall): of all epochs PSG classified as a given stage, what proportion did the device correctly identify? A low sensitivity for deep sleep means the device misses a lot of PSG-confirmed deep sleep.
- Precision (positive predictive value): of all epochs the device classified as a given stage, what proportion were actually that stage according to PSG? Low precision means the device over-assigns a stage.
- Overall accuracy: proportion of all epochs correctly classified across all stages.
- Cohen's kappa (κ): measures agreement beyond chance. Values above 0.60 indicate substantial agreement; 0.40–0.60 indicates moderate agreement; below 0.40 is fair or poor.
- Intraclass correlation coefficient (ICC): measures reliability of a continuous measure (like total minutes in a stage) between the device and PSG. ICC above 0.75 is generally considered good; below 0.40 is poor.
- Mean deviation: the average difference in minutes between the device's estimate and PSG for a given stage across participants. A small mean deviation can coexist with poor individual-night reliability.
Oura Ring: What the Published Evidence Shows
Two peer-reviewed PSG validation studies are available for Oura Ring Gen3 running the OSSA 2.0 algorithm. These are the studies directly relevant to current Oura hardware.
Robbins et al. 2024 (Harvard/Brigham and Women's Hospital)
Published in Sensors, this study enrolled 35 healthy adults for a single night of simultaneous PSG and Oura Ring Gen3 recording in a sleep laboratory. The key finding: Oura Ring was not significantly different from PSG for any of the four sleep stages — wake, light sleep, deep sleep, or REM sleep — or for total sleep time.
In four-stage classification, the device achieved sensitivities of 78.2% for light sleep, 79.5% for deep sleep, and 76.0% for REM sleep, with corresponding precision values of 79.5%, 77.0%, and 79.1%. The four-stage Cohen's kappa was 0.65, indicating substantial agreement with PSG.
However, the ICC values for deep sleep (0.32) and REM sleep (0.27) were poor, meaning that while group means did not differ significantly from PSG, individual-night estimates for these stages were unreliable.
Svensson et al. 2024 (Sleep Medicine)
A larger and methodologically stronger study, published in Sleep Medicine, enrolled 96 generally healthy Japanese adults aged 20–70 across multiple nights in a home setting, generating 421,045 scored epochs. This multi-night, real-world design is more representative of how people actually use the device.
Overall accuracy was 91.7–91.8%. Sensitivity for sleep detection (distinguishing sleep from wake) was 94.4–94.5%. Sleep staging accuracy ranged from 75.5% for light sleep to 90.6% for REM sleep. The Oura Ring slightly underestimated REM sleep by 4.1–5.6 minutes and sleep efficiency by 1.1–1.5%. PABAK interrater reliability was 0.83–0.84. Rings worn on both dominant and non-dominant hands showed comparable performance (inter-device reliability 94.8%).
The Svensson study did not report industry funding from Oura and enrolled a substantially larger and more diverse sample than Robbins et al., making it the more informative of the two studies for real-world accuracy expectations.
WHOOP: What the Published Evidence Shows
The most comprehensive independent review of WHOOP's sleep accuracy is Schyvens et al. 2024, a systematic review published in JMIR mHealth and uHealth that synthesized four WHOOP vs. PSG comparison studies. The review authors declared no conflicts of interest.
Across the four studies (sample sizes ranging from n=5 to n=53), WHOOP showed strong total sleep time accuracy — a mean deviation of only -1.4 minutes from PSG. Performance for light sleep (-9.6 min) and deep sleep (-9.3 min) was also relatively close at the group level.
The most consistent finding across studies was systematic REM overestimation. WHOOP overestimated REM sleep by an average of 21.0 minutes across the four comparisons, ranging from 6.0 to 22.9 minutes in individual studies. This was the largest REM disagreement of the three devices reviewed (Fitbit Charge 4, Garmin Vivosmart 4, and WHOOP).
Stage-specific sensitivities averaged 60% for light sleep, 65% for deep sleep, and 67% for REM sleep. Overall agreement ranged from 60–64%. Cohen's kappa for multi-stage classification was 0.44–0.47, indicating moderate agreement with PSG.
Head-to-Head Accuracy Comparison
| Metric | Oura Ring Gen3 (OSSA 2.0) | WHOOP (3.x era hardware) |
|---|---|---|
| Total sleep time deviation | Not significantly different from PSG (Robbins); mild underestimate (Svensson) | Mean −1.4 min from PSG (strong) |
| Light sleep sensitivity | 78.2% (Robbins) | ~60% (Schyvens review average) |
| Deep sleep sensitivity | 79.5% (Robbins) | ~65% (Schyvens review average) |
| REM sleep sensitivity | 76.0% (Robbins) | ~67% (Schyvens review average) |
| REM deviation from PSG | Underestimate of 4.1–5.6 min (Svensson) | Overestimate of mean 21.0 min (range 6.0–22.9 min) |
| Overall accuracy | 91.7–91.8% (Svensson) | 60–64% (Schyvens review) |
| Cohen's kappa (multi-stage) | 0.65 (Robbins) — substantial agreement | 0.44–0.47 — moderate agreement |
| Deep sleep ICC | 0.32 — poor individual-night reliability | Not reported in reviewed studies |
| REM ICC | 0.27 — poor individual-night reliability | Not reported in reviewed studies |
| Study independence | Robbins: industry-funded, COI declared. Svensson: no declared Oura funding. | Schyvens review: no COI declared |
| Hardware validated | Gen3 with OSSA 2.0 | Primarily WHOOP 3.x; WHOOP 5.0 not yet independently validated |
Scoring Systems: Oura Sleep Score vs. WHOOP Sleep Performance Percentage
The summary scores each device produces are not measuring the same thing, and they cannot be meaningfully compared to each other.
Oura's Sleep Score is a 0–100 composite that incorporates estimated sleep stages, sleep efficiency, sleep timing (alignment with your circadian window), HRV balance, and body temperature deviation. It is a multi-dimensional score that weights physiological recovery signals alongside time-in-stage estimates.
WHOOP's Sleep Performance Percentage, as described in WHOOP's own published explanation, is calculated from four components: sleep sufficiency (hours obtained vs. hours needed), sleep consistency (timing relative to prior four nights), sleep efficiency (proportion of time in bed spent asleep), and sleep stress (time in high-stress states overnight). It is primarily a sufficiency and consistency metric, not a staging-accuracy metric.
| Component | Oura Sleep Score | WHOOP Sleep Performance % |
|---|---|---|
| Sleep stage estimates | Yes — weighted component | Indirect (via sufficiency calculation) |
| Sleep efficiency | Yes | Yes |
| Sleep timing / consistency | Yes — circadian alignment | Yes — consistency vs. prior 4 nights |
| HRV input | Yes — HRV balance | Feeds into Recovery score, not Sleep Performance directly |
| Body temperature | Yes — deviation from baseline | No |
| Sleep sufficiency vs. need | No | Yes — primary component |
| Score range | 0–100 | 0–100% |
| Interchangeable? | No | No |
Real-world simultaneous-wear data illustrates how different the scores can be in practice. Published practitioner data found a correlation of only r=0.41 between WHOOP Recovery Score and Oura Readiness Score over 93 days of simultaneous wear. Part of the divergence comes from different variable weightings: WHOOP Recovery is heavily influenced by HRV (accounting for approximately 56% of variance explained), while Oura Readiness is more strongly influenced by resting heart rate (approximately 29%). Two devices worn on the same body the same night can produce very different summary scores — and both can be internally consistent with their own inputs while still disagreeing with each other.
HRV Measurement: How Each Device Differs
Both devices measure heart rate variability from PPG-derived interbeat intervals, but they calculate the overnight HRV figure differently.
Oura calculates HRV as an average across the full night, typically reported as the rMSSD (root mean square of successive differences) — a standard time-domain HRV metric. This whole-night average smooths out the natural variation in HRV across sleep stages.
WHOOP uses a dynamically weighted calculation that gives greater emphasis to HRV values recorded during specific sleep phases. The precise weighting is proprietary and undisclosed, which means the two devices' HRV figures are not directly comparable even when derived from the same night's physiology.
Real-world simultaneous-wear data shows that individual-level HRV score correlation between the two devices varies substantially — approximately r=0.61 for some individuals and r=0.92 for others. This wide range means that for some users the two devices track HRV trends similarly, while for others they diverge considerably. Neither methodology is independently auditable, so there is no way to determine which is "more correct" without a simultaneous clinical reference.
Total Cost of Ownership
The two devices have structurally different cost models. Oura Ring 4 requires an upfront hardware purchase; WHOOP 5.0's hardware cost is bundled into the subscription. This reverses the Year 1 vs. Year 3 cost picture.
| Oura Ring 4 | WHOOP 5.0 (Peak tier) | |
|---|---|---|
| Hardware cost | $349 upfront | $0 (included in subscription) |
| Subscription cost | $5.99/month | $239/year (~$19.92/month) |
| Year 1 total | ~$421 ($349 + $71.88) | ~$239 |
| Year 2 total (cumulative) | ~$493 | ~$478 |
| Year 3 total (cumulative) | ~$565 | ~$717 |
| Hardware tied to subscription? | No — ring retains basic function without membership | Yes — device is tied to subscription continuation |
Who Each Device Suits for Sleep-Specific Use
Neither device is objectively better for every user. The right choice depends on what you are trying to track and how you use the data.
Oura Ring is likely the better fit if:
- Sleep staging accuracy is your primary goal — Oura has substantially more and stronger independent PSG validation evidence, with a four-stage kappa of 0.65 vs. WHOOP's 0.44–0.47.
- You prefer a ring form factor and want a device that is less visible and easier to wear continuously without the feel of a wristband.
- You want lower long-term subscription costs — at Year 3, Oura's cumulative cost is roughly $150 less than WHOOP at current pricing.
- You want body temperature deviation tracking as part of your sleep data — Oura includes this; WHOOP does not incorporate it into its sleep scoring.
- You do not require ECG capability — Oura Ring 4 does not include ECG.
WHOOP is likely the better fit if:
- You want integrated strain-based training guidance alongside sleep data — WHOOP's Recovery and Strain system is more developed for athletic training load management.
- You want ECG capability — WHOOP 5.0 includes ECG; Oura Ring 4 does not.
- Total sleep time accuracy matters more to you than stage-level accuracy — WHOOP's TST deviation (-1.4 min from PSG) is strong, even if its stage-specific performance is weaker.
- You prefer a wristband form factor and do not mind wearing a device on your wrist during sleep.
- Lower Year 1 cost is a priority — WHOOP's subscription-only model means no large upfront payment.
Shared Limitations Both Buyers Should Understand
Before purchasing either device, there are structural limitations that apply to both — limitations that most product reviews do not address clearly.
Both devices use proprietary black-box algorithms. Neither Oura nor WHOOP discloses the architecture, training data, or weighting of its sleep-staging algorithm. A 2024 scoping review in npj Digital Medicine found that only 17% of PPG-capable wearables in the reviewed literature reported the algorithm used for staging — making independent replication impossible for the vast majority of devices, including these two.
All major PSG validation studies used healthy adult populations only. The same npj Digital Medicine review found that 25 of 35 reviewed validation articles recruited healthy participants exclusively. Neither Oura nor WHOOP has published validation data for people with insomnia, sleep apnea, or other sleep disorders. If you have a diagnosed condition, the accuracy figures cited in this article do not apply to your situation.
Individual-night deep sleep and REM estimates are unreliable for both devices. Even Oura's better-validated hardware shows ICC values of 0.27–0.32 for REM and deep sleep at the individual night level. A broad population average can match PSG while your specific estimate on a specific night diverges substantially. This is not a flaw unique to Oura or WHOOP — it is a ceiling shared by all current consumer wearables.
There is also a clinically documented psychological risk associated with consumer sleep tracking. In 2017, Baron et al. published a case series in the Journal of Clinical Sleep Medicine describing patients who developed a preoccupation with achieving ideal sleep tracker scores — a pattern they termed orthosomnia.
"Despite multiple validation studies that have demonstrated consumer-wearable sleep tracking devices are unable to accurately discriminate stages of sleep and have poor accuracy in detecting wake after sleep onset, we found patients' perceptions difficult to alter."
The orthosomnia case series described patients who sought treatment based on tracker data, found it difficult to engage with behavioral sleep therapy, and maintained beliefs about their sleep that persisted even after PSG showed normal results. For anyone who already experiences anxiety about sleep, the addition of a device that produces nightly stage estimates — estimates with the accuracy limitations described above — carries a real risk of worsening that anxiety rather than resolving it.
Key Takeaways
- Oura Ring has more and stronger independent PSG validation evidence for sleep staging. Two peer-reviewed studies show four-stage kappa of 0.65 and overall accuracy of 91.7–91.8% for Gen3 with OSSA 2.0. The key industry-funded study (Robbins et al.) must be interpreted with that conflict of interest in mind.
- WHOOP's total sleep time accuracy is strong, but its REM overestimation is a consistent finding. A mean REM overestimation of 21 minutes across four PSG comparisons is the largest REM disagreement of the three devices reviewed in Schyvens et al. 2024. Stage-specific sensitivity (60–67%) and kappa (0.44–0.47) are below Oura's validated figures.
- WHOOP 5.0 has no published independent PSG validation. All reviewed WHOOP accuracy data comes from earlier hardware (primarily 3.x era). Whether WHOOP 5.0 improves on these figures is unknown from peer-reviewed evidence as of June 2026.
- Individual-night stage accuracy is limited for both devices. Poor ICC values for deep sleep and REM (under 0.40 even for Oura) mean single-night stage totals can diverge substantially from PSG at the individual level. Track trends, not individual nights.
- Oura Sleep Score and WHOOP Sleep Performance Percentage are not comparable. They use different inputs, different weightings, and answer different questions. The real-world correlation between the two devices' summary recovery/readiness scores is only r=0.41.
- Cost curves favor WHOOP in Year 1, Oura in Year 3. At current pricing, WHOOP costs approximately $239 in Year 1 vs. Oura's ~$421. By Year 3, Oura's cumulative cost (~$565) is lower than WHOOP's (~$717). Verify current pricing before purchase.
- Neither device is a substitute for clinical sleep evaluation. Both are consumer wellness products validated only in healthy adult populations. If you have a sleep disorder or significant sleep anxiety, discuss wearable use with a clinician before relying on the data.
- Orthosomnia is a real risk. Clinically documented cases exist of patients developing treatment-resistant sleep anxiety driven by wearable sleep data. If you already experience anxiety about your sleep, consider whether adding nightly stage tracking will help or worsen that pattern.
Supports these guides
Spot an error or have clinical feedback?
Because this article covers clinical, medication, or safety information, we use a moderated correction channel instead of open public comments. Let us know if something about “Oura Ring vs. WHOOP for Sleep Tracking: What the PSG Validation Evidence Actually Shows” needs a closer look.
Send feedback on this article