Mechanism explainer
WHOOP Band Sleep Tracking Review: Accuracy, Metrics, and How It Compares
An evidence-anchored review of WHOOP's sleep tracking capabilities, examining what the device actually measures, what independent PSG validation studies show metric by metric, and how WHOOP compares to Oura Ring, Garmin, Apple Watch, and Fitbit on sleep accuracy.
WHOOP markets itself as a recovery platform built around sleep. The device collects more physiological data per second than most consumer wearables, and its HRV measurement during sleep has been independently validated as the most accurate of any wrist-worn device tested against ECG. But the same independent studies that confirm WHOOP's cardiovascular data quality also show that four-stage sleep classification — the breakdown into light, deep, REM, and wake — carries moderate error, with REM systematically overestimated across every published PSG comparison.
This review synthesizes what peer-reviewed validation studies actually show, metric by metric, and places WHOOP's performance within a six-device comparison. The goal is to help you interpret your WHOOP sleep data with calibrated confidence — knowing where to trust the numbers and where to treat them as directional.
How WHOOP Measures Sleep: Sensors and Algorithm
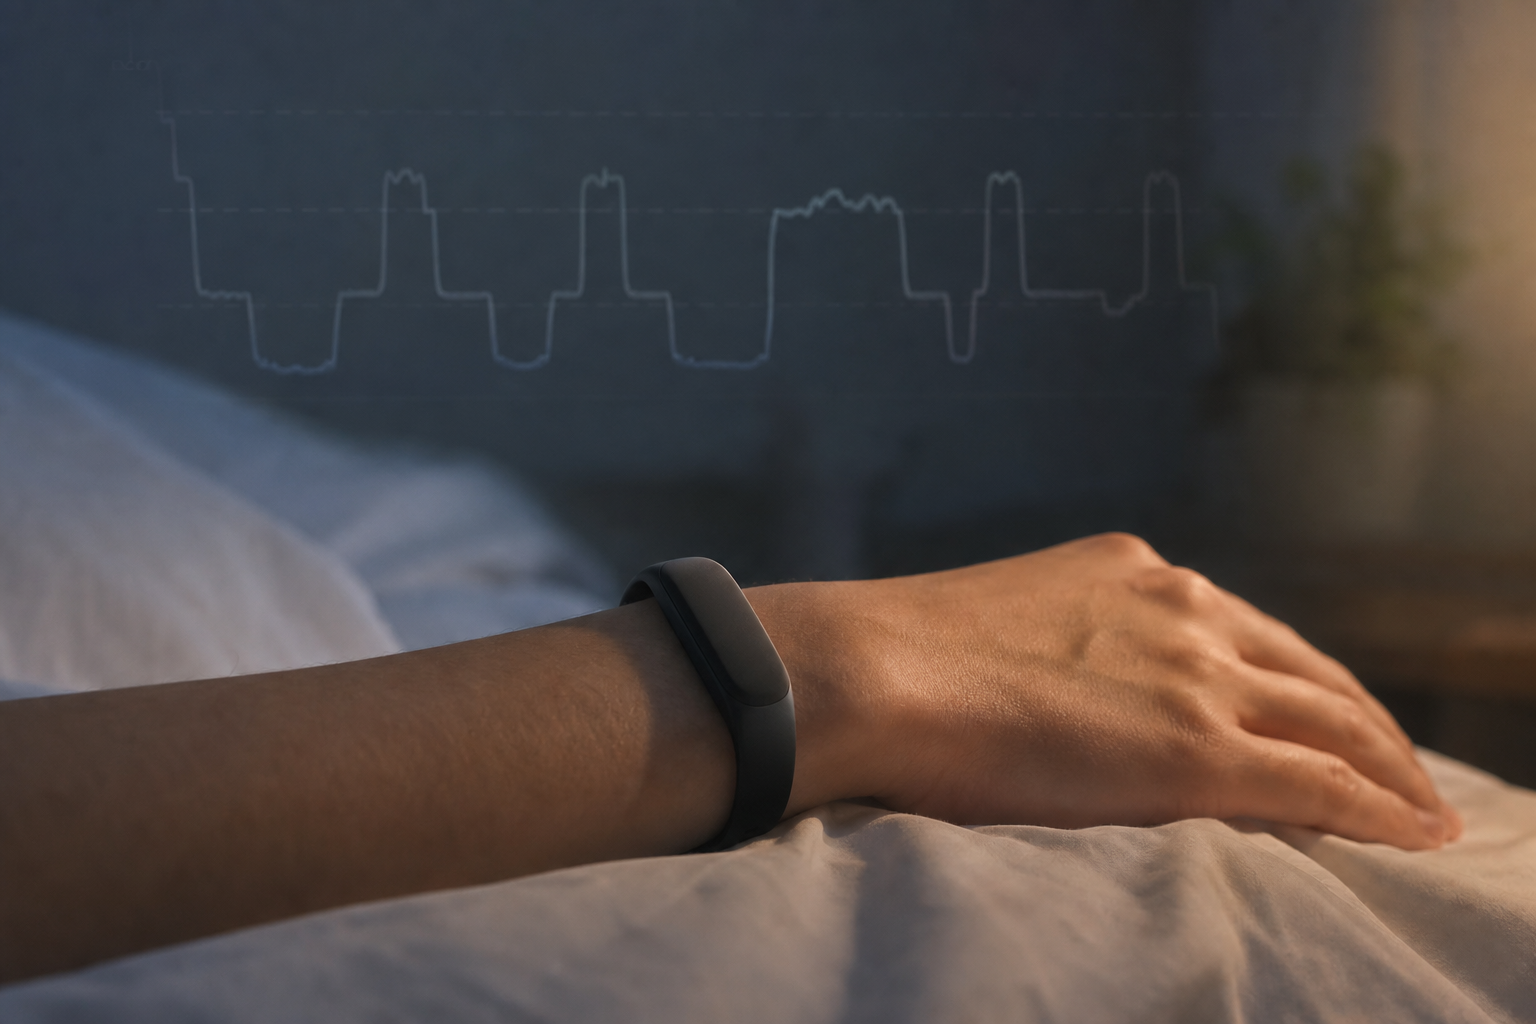
WHOOP uses three hardware inputs to infer sleep state: a photoplethysmography (PPG) sensor with green LEDs and a photoreceptor, a 3-axis accelerometer, and a 3-axis gyroscope. Together, these sensors capture hundreds of data points per second — primarily beat-to-beat R-R intervals from the PPG signal and movement data from the accelerometers.
The raw R-R interval stream and movement data feed machine learning models that were trained on polysomnography (PSG) recordings — the gold-standard sleep study that uses EEG brain activity, eye movement sensors, and muscle tone to classify sleep stages. WHOOP's algorithm attempts to replicate PSG stage classifications using only peripheral cardiovascular and motion signals, without any direct brain activity measurement. This distinction matters when interpreting stage accuracy.
Sleep onset and offset are auto-detected rather than manually set. The device infers when you fall asleep and wake up based on changes in movement and heart rate patterns, without requiring you to start a sleep session. This convenience comes with a documented tradeoff: the algorithm can classify extended periods of quiet wakefulness — lying still in bed before sleep or after waking — as sleep, which inflates total sleep time estimates compared to ring-based sensors.
What Changed with WHOOP 5.0
WHOOP 5.0, launched in May 2025, introduced a 14+ day battery life and sensors described as capturing data with 10× more power efficiency than prior hardware. The device can now be worn at multiple body locations beyond the wrist. A new WHOOP MG variant adds ECG capabilities for AFib screening and cuff-calibrated blood pressure insights, though both are explicitly not classified as medical devices.
The Sleep Performance Score was also updated with WHOOP 5.0 to combine four components: Sleep Sufficiency, Sleep Consistency, Sleep Efficiency, and Sleep Stress. The official WHOOP launch announcement focused on hardware improvements and new health features rather than describing specific changes to the sleep staging algorithm itself. Because no independent PSG study has tested the 5.0 algorithm, it is not possible to determine whether the hardware improvements translate to better sleep stage accuracy.
Full Metric Inventory: What WHOOP Reports and How Each Is Calculated
WHOOP produces a larger set of sleep-related metrics than most consumer wearables. Understanding how each is derived — and where it feeds the recovery score — helps you decide which numbers to weight more heavily in your own interpretation.
| Metric | What It Measures | How It's Derived | Feeds Recovery Score? |
|---|---|---|---|
| Sleep Stages (Light/N1+N2, Deep/SWS/N3, REM, Wake) | Time spent in each sleep stage | PPG + accelerometer data fed into ML model trained on PSG | Indirectly (via TST and sleep quality signals) |
| Total Sleep Time (TST) | Total time classified as asleep | Sum of non-wake stage epochs | Yes — via Sleep Sufficiency |
| Sleep Efficiency | Percentage of time in bed spent asleep | TST ÷ time in bed × 100 | Yes — one of four Sleep Performance Score components |
| Sleep Latency | Time from bed entry to sleep onset | Auto-detected from movement and HR changes | No — informational |
| Sleep Consistency | Timing of sleep vs. prior four nights | Deviation from rolling 4-night average sleep window | Yes — one of four Sleep Performance Score components |
| Sleep Need | Individualized nightly sleep target | Baseline + prior day strain + accumulated sleep debt | Yes — determines Sufficiency calculation |
| Sleep Debt | Cumulative shortfall vs. sleep need | Rolling sum of TST vs. sleep need over prior days | Yes — feeds Sleep Need calculation |
| Sleep Performance Score | Composite sleep quality score (0–100) | Weighted combination of Sufficiency, Consistency, Efficiency, Stress | Yes — primary sleep input to recovery |
| Sleep Stress | Time in elevated stress state during sleep | HRV-derived stress inference during sleep epochs | Yes — one of four Sleep Performance Score components |
| Respiratory Rate | Breaths per minute during sleep | Derived from PPG signal waveform patterns | Yes — included in recovery calculation |
| Resting Heart Rate (RHR) | Lowest heart rate during sleep | Weighted average; SWS epochs given more weight | Yes — primary recovery input |
| Heart Rate Variability (HRV) | Beat-to-beat variation during sleep | R-R interval data from PPG; measured during lowest-HR sleep period | Yes — primary recovery input |
The recovery score is the metric most WHOOP users check first each morning. It is built primarily on cardiovascular trend data captured during sleep — HRV, resting heart rate, and respiratory rate — not on brain activity measurement. Sleep stage classification informs the score indirectly through Sleep Sufficiency and Sleep Stress, but the cardiovascular signals carry the most weight. This means the recovery score can be meaningfully accurate even when sleep stage classification contains errors.
Resting heart rate is calculated as a weighted average during sleep, with slow-wave sleep (SWS/N3) epochs given more weight. This means the RHR figure WHOOP reports is not simply the lowest heart rate of the night — it is a physiologically weighted estimate of cardiovascular rest state, which is a more meaningful input to recovery than a raw minimum.
What Independent PSG Validation Studies Show: Metric by Metric
Three peer-reviewed sources provide the most complete picture of WHOOP's validated accuracy. The Miller et al. 2022 study from Central Queensland University tested six wearable devices simultaneously against PSG in 53 healthy adults. The Schyvens et al. 2024 systematic review in JMIR synthesized four separate WHOOP-vs-PSG comparisons. The Khodr et al. 2024 systematic review on medRxiv assessed 15 WHOOP studies across multiple health metrics. Together, they allow a metric-by-metric assessment that separates WHOOP's genuine strengths from its documented limitations.
| Metric | Finding | Source |
|---|---|---|
| Multi-state sleep agreement | 60% agreement; Cohen kappa 0.44 (moderate) | Miller et al. 2022 (PMC9412437) |
| Multi-state kappa range | 0.44–0.47 across three Miller studies; mean 62% agreement | Schyvens et al. 2024 (PMC11004611) |
| REM sensitivity | 66% of REM epochs correctly identified | Miller et al. 2022 |
| Deep sleep (SWS) sensitivity | 62% of deep sleep epochs correctly identified | Miller et al. 2022 |
| Light sleep sensitivity | 58% of light sleep epochs correctly identified | Miller et al. 2022 |
| Wake detection sensitivity | 56% of wake epochs correctly identified | Miller et al. 2022 |
| TST bias (Miller) | −12.2 min vs. PSG; absolute bias 30.3 min | Miller et al. 2022 |
| TST bias (Schyvens) | Mean −1.4 min vs. PSG (best of all three devices reviewed) | Schyvens et al. 2024 |
| REM overestimation (Miller) | +22.9 min (±45.4 min SD) vs. PSG | Miller et al. 2022 |
| REM overestimation (Schyvens) | Mean +21.0 min vs. PSG (highest of all three devices reviewed) | Schyvens et al. 2024 |
| Light sleep bias (Schyvens) | −9.6 min vs. PSG | Schyvens et al. 2024 |
| Deep sleep bias (Schyvens) | −9.3 min vs. PSG | Schyvens et al. 2024 |
| HRV intraclass correlation vs. ECG | ICC = 0.99; absolute bias 4.7 ms; LoA ±7.6 ms | Miller et al. 2022 |
| Heart rate intraclass correlation vs. ECG | ICC = 0.99; absolute bias 0.7 bpm | Miller et al. 2022 |
| Two-stage sleep accuracy | Acceptable; room for improvement on four-stage classification | Khodr et al. 2024 (medRxiv) |
A Cohen kappa of 0.44 indicates moderate agreement between WHOOP's stage classifications and PSG — not high precision. In practical terms, roughly 40% of individual sleep stage classifications on any given night will differ from what a sleep lab would record. This does not mean the data is useless, but it does mean individual-night stage readings should be treated as approximate rather than definitive.
The HRV and heart rate findings are a different story. An intraclass correlation of 0.99 against ECG gold standard — with an absolute bias of only 4.7 ms for HRV and 0.7 bpm for heart rate — represents near-clinical-grade accuracy for cardiovascular signals during sleep. This is the strongest validated finding in WHOOP's published evidence base, and it directly supports the recovery score's reliability as a cardiovascular trend indicator.
The REM overestimation finding is consistent and substantial across all four independent comparisons synthesized by Schyvens et al. — averaging more than 20 minutes per night. This is not a rounding error or a study-specific artifact. It reflects a systematic tendency in WHOOP's algorithm to classify certain light sleep or transitional states as REM. For users tracking REM trends over time, this means the absolute REM values are likely inflated, though relative changes from night to night may still carry useful directional information.
The Khodr et al. systematic review, which examined 15 WHOOP studies, notes that personalized algorithms — those that adapt to an individual's physiological baseline over time — can improve device performance. This is consistent with WHOOP's own recommendation that sleep need accuracy stabilizes after approximately 28 days of continuous wear.
How WHOOP Compares to Other Sleep Trackers
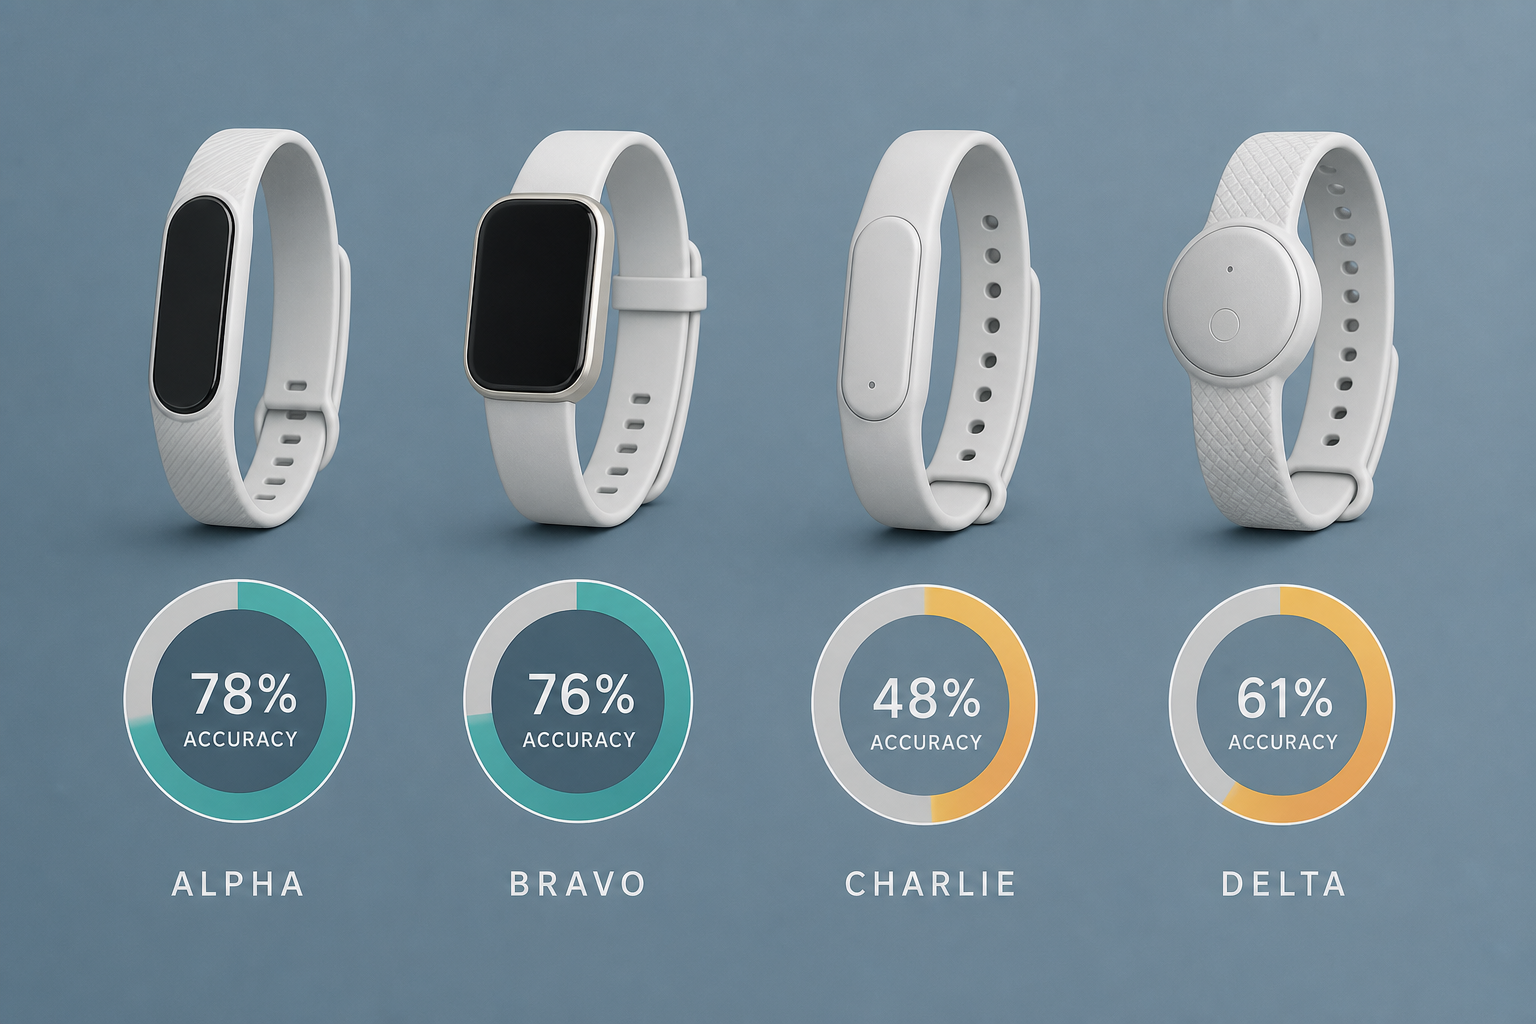
The Miller et al. 2022 CQU study provides the most direct like-for-like comparison available: six devices tested simultaneously on the same 53 participants against the same PSG recordings. The Terra Research 2026 dataset adds real-world context from 77,000+ filtered sleep episodes across six manufacturers, including 2,144 overlapping same-person, same-night multi-device nights.
| Device | Multi-State Agreement | Cohen Kappa | REM Sensitivity | Wake Detection | TST Bias vs. PSG | HRV ICC vs. ECG |
|---|---|---|---|---|---|---|
| WHOOP 3.0 | 60% | 0.44 | 66% | 56% | −12.2 min | 0.99 |
| Oura Gen 2 | 61% | 0.43 | 52% | 57% | +1.5 min | Not reported |
| Somfit | Higher than WHOOP/Oura | Higher than WHOOP/Oura | Not reported | Not reported | Not reported | Not reported |
| Garmin Vivosmart 4 | 50% | 0.25 | Not reported | Not reported | Not reported | Not reported |
| Apple Watch | 53% | 0.20 | Not reported | Not reported | +39.5 min | Not reported |
| Polar | Not reported | Not reported | Not reported | Not reported | Not reported | Not reported |
The WHOOP vs. Oura comparison is the most practically useful for readers choosing between the two leading sleep-focused wearables. Multi-state kappa is nearly identical — 0.44 for WHOOP versus 0.43 for Oura — meaning neither device has a meaningful accuracy advantage for overall sleep stage classification. The differences lie in specific metrics.
WHOOP detects REM sleep more reliably (66% sensitivity vs. 52% for Oura). Oura has better wake detection (57% vs. 56%) and substantially lower TST bias (+1.5 min vs. −12.2 min). The TST difference matters in practice: WHOOP tends to classify quiet wakefulness as sleep more often than Oura's ring-based sensor, which results in inflated total sleep time estimates on many nights.
The Terra Research 2026 real-world dataset — analyzing overlapping same-person, same-night recordings across devices — quantifies this divergence at scale. WHOOP reported longer total sleep time than Oura on 57% of direct-comparison nights, with a median difference of 16.6 minutes and a mean of 45.2 minutes (the mean is pulled up by significant outlier nights). WHOOP reported longer TST than Eight Sleep on 81% of comparison nights, with a median difference of 21.6 minutes. The Terra analysis attributes this pattern to WHOOP's algorithm being more lenient in classifying quiet wakefulness as sleep — a tendency that may be appropriate for athlete recovery contexts where distinguishing true sleep from restful wakefulness matters less than capturing cardiovascular recovery state.
For readers also considering Apple Watch: the CQU study found Apple Watch achieved a multi-state kappa of 0.20 and 53% agreement — substantially below both WHOOP and Oura. Apple Watch also showed a TST overestimate of +39.5 minutes vs. PSG. A detailed head-to-head covering accuracy, cost, and decision factors is available in the Apple Watch vs. WHOOP sleep tracking comparison on this site.
Known Limitations and Contextual Caveats
Each of the following limitations is documented in independent peer-reviewed literature or confirmed by WHOOP's own disclosures. They are not reasons to dismiss WHOOP's sleep data, but they are necessary context for interpreting it accurately.
- REM systematic overestimation. WHOOP overestimates REM sleep by an average of 21–23 minutes per night across all four independent PSG comparisons in the published literature. This is the most consistent limitation in WHOOP's sleep tracking evidence base. Absolute REM values should not be taken at face value; relative night-to-night changes may still be directionally useful.
- Quiet wakefulness classified as sleep. WHOOP's algorithm is more lenient than ring-based sensors in classifying still, low-heart-rate wakefulness as sleep. This inflates TST on a majority of nights compared to Oura, with median differences of 16–22 minutes in real-world comparisons. If you frequently lie awake in bed before falling asleep or after waking, your WHOOP TST figures are likely overstated.
- Validation conducted on healthy young adults only. All published PSG validation studies for WHOOP were conducted predominantly on healthy, active young adults with a mean age of approximately 22–25 years. Accuracy in people with chronic insomnia, fragmented sleep, older adults, or those with sleep-disordered breathing has not been independently validated. Extrapolating the published accuracy figures to these populations is not supported by the available evidence.
- WHOOP 5.0 algorithm is unvalidated. The updated sleep algorithm introduced with WHOOP 5.0 in early 2025 has not been independently tested against PSG as of June 2026. All accuracy statistics in this article apply to WHOOP 3.0.
- Algorithm non-disclosure limits external reproducibility. WHOOP does not publicly disclose how its PPG signals are processed or how stage classification decisions are made. This means independent researchers cannot fully replicate or audit the algorithm, and it limits confidence in how findings from one hardware generation transfer to another.
- 28-day calibration period for sleep need accuracy. WHOOP's individualized sleep need calculation — which drives the Sleep Sufficiency component of the Sleep Performance Score — requires approximately 28 days of continuous wear to establish a reliable personal baseline. Sleep need figures in the first month of use should be treated as approximate.
- Wrist placement vs. ring-based sensors. Wrist-based PPG is more susceptible to motion artifact and signal noise than finger-based sensors. Ring-based devices like Oura benefit from the denser capillary bed and more stable contact at the finger, which may contribute to Oura's lower TST bias in validation studies.
- Auto-detection accuracy is partially untested. The Khodr et al. systematic review notes that most validation studies manually adjust sleep detection times before analysis. This means the published accuracy figures may not fully reflect real-world auto-detection performance, which could be lower.
Who Gets the Most from WHOOP Sleep Tracking — and Who Should Temper Expectations
WHOOP's validated strengths and documented limitations point toward a fairly specific user profile where the device delivers genuine value — and a different profile where expectations should be adjusted before purchase.
Users Likely to Get the Most Value
- Recovery-focused athletes and people using sleep to manage training load. WHOOP's recovery score is built on HRV and resting heart rate — both validated at ICC 0.99 vs. ECG. For users whose primary goal is understanding how well their body recovered overnight and adjusting training intensity accordingly, this cardiovascular trend data is genuinely strong and consistently accurate.
- People committed to continuous, long-term wear. WHOOP's personalized baseline approach means the device becomes more useful over time. Users who wear it consistently — including during the 28-day calibration period — will get more accurate sleep need calculations and more meaningful trend data than occasional users.
- Users who want HRV trend monitoring during sleep. No other wrist-worn device in the Miller et al. 2022 six-device study matched WHOOP's HRV accuracy against ECG. For users specifically interested in tracking autonomic nervous system recovery through HRV, WHOOP offers the strongest validated measurement available in a consumer wearable.
Users Who Should Temper Expectations
- People with chronic insomnia or sleep disorders. WHOOP is a consumer wellness product, not a medical device, and cannot diagnose or monitor sleep disorders. WHOOP's own documentation states this explicitly. Validation studies were conducted on healthy sleepers; accuracy in insomnia populations is unknown. For readers managing insomnia, clinical evaluation and evidence-based treatment — not wearable sleep scores — should be the primary reference.
- People seeking clinical-grade sleep stage precision. A multi-state kappa of 0.44 means roughly 40% of individual stage classifications on any given night may differ from PSG. If you are making health decisions based on specific REM or deep sleep readings, the documented error margins are large enough to make individual-night stage data unreliable as a clinical reference.
- Infrequent exercisers or sedentary users. WHOOP's sleep need calculation incorporates day strain — a measure of training and activity load. For users with consistently low activity levels, the strain-based model may not calibrate sleep need as meaningfully as it does for athletes. The recovery score's framing is also built around athletic performance optimization, which may feel less relevant for non-exercising users.
- Users primarily interested in accurate total sleep time. WHOOP's tendency to classify quiet wakefulness as sleep means TST figures are likely overstated for users who spend time lying still before falling asleep or after waking. If accurate TST is the primary metric you care about, Oura's lower TST bias (+1.5 min vs. −12.2 min in the CQU study) makes it a more reliable reference.
The most accurate way to use WHOOP sleep data is to treat cardiovascular metrics — HRV, resting heart rate, respiratory rate — as reliable trend indicators and to treat sleep stage breakdowns as directional rather than precise. Consistent changes in your recovery score over multiple nights carry more signal than any single night's reading, and the stage percentages are most useful as rough proportional guides rather than exact measurements.
Supports these guides
Spot an error or have clinical feedback?
Because this article covers clinical, medication, or safety information, we use a moderated correction channel instead of open public comments. Let us know if something about “WHOOP Band Sleep Tracking Review: Accuracy, Metrics, and How It Compares” needs a closer look.
Send feedback on this article