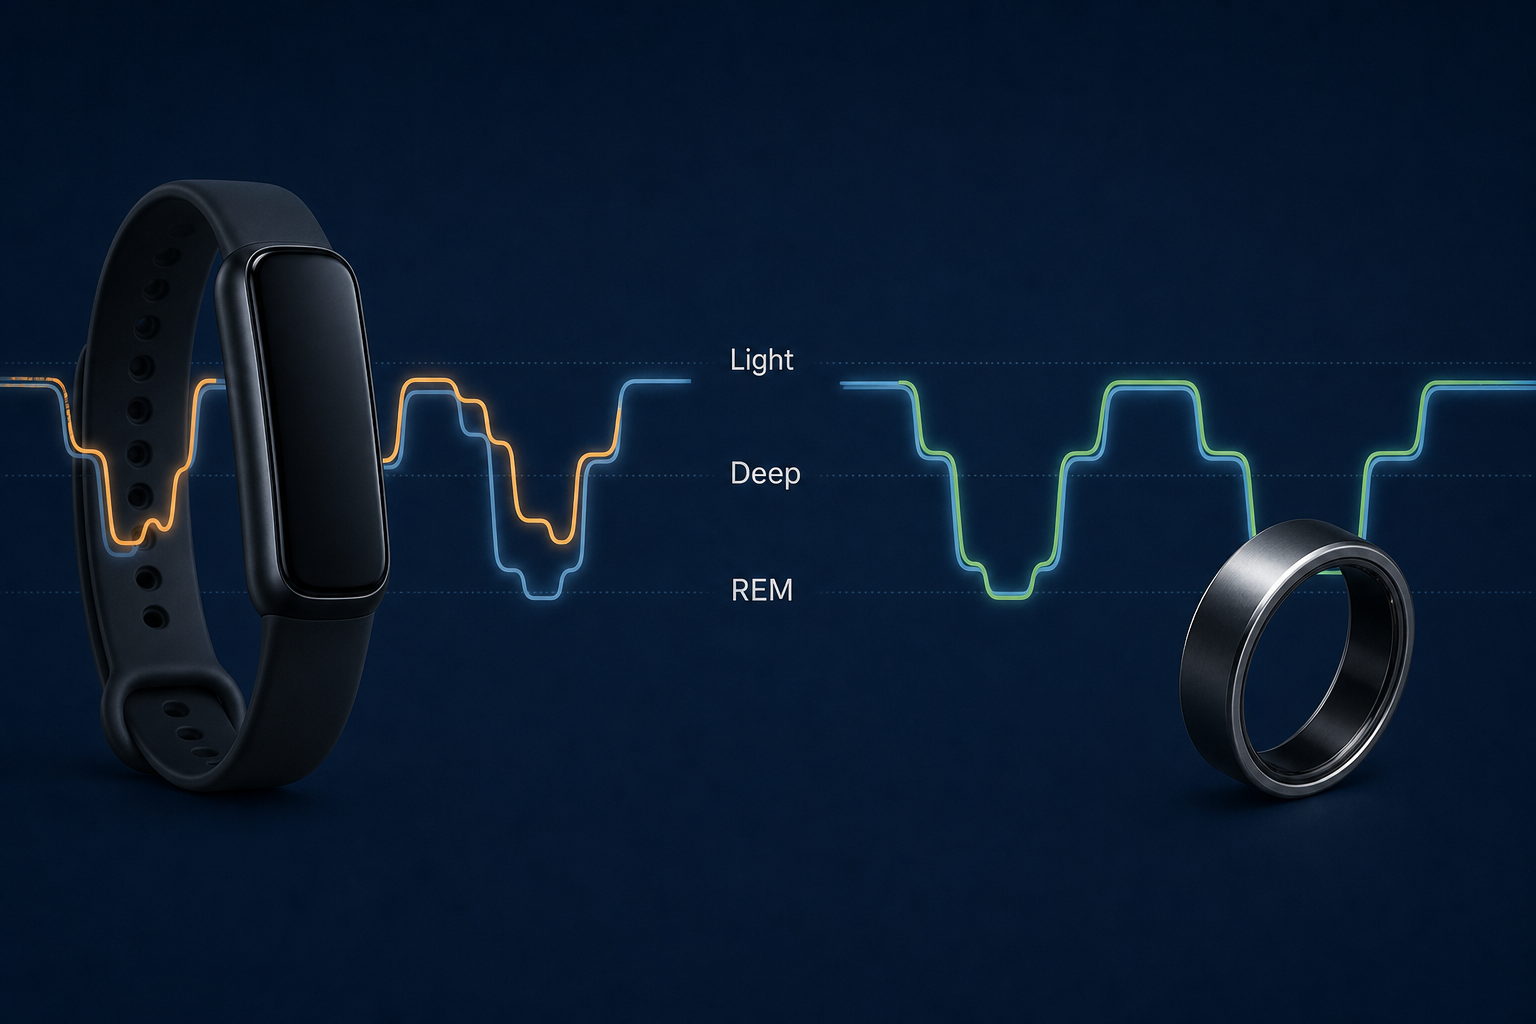
Mechanism explainer
Fitbit Sleep Tracking Review: Accuracy, Sleep Stages, and How It Compares to the Oura Ring
A PSG-validated look at what Fitbit sleep data actually measures reliably — and where it falls short — for adults who want evidence-based guidance on trusting their sleep stage readings or deciding between Fitbit and the Oura Ring.
Why PSG Validation Matters for Consumer Sleep Trackers
Most sleep tracker reviews compare features, prices, and app designs. This article takes a different approach: it evaluates Fitbit's sleep tracking against polysomnography (PSG) — the clinical gold standard for measuring sleep.
PSG is a multi-channel overnight recording that simultaneously measures brain electrical activity (EEG), eye movements (EOG), and muscle tone (EMG). Trained technicians score the resulting data into four sleep stages — N1 (light), N2 (light), N3 (deep or slow-wave), and REM — according to standardized criteria from the American Academy of Sleep Medicine. This is how clinicians diagnose sleep disorders and how researchers define "ground truth" sleep architecture.
Consumer wearables cannot replicate EEG. They infer sleep stages from heart rate variability and movement signals captured at the wrist or finger. The question PSG validation answers is: how closely do those inferences match what the brain is actually doing?
The answer matters for practical reasons. If a device reliably captures your total sleep time and sleep efficiency, it can help you identify broad patterns — whether you are consistently getting too little sleep, or whether a behavioral change is improving your nights. If it misclassifies sleep stages systematically, then acting on those stage readings — for example, worrying about low deep sleep numbers — may produce anxiety without clinical basis.
How Fitbit Measures Sleep: Sensors, Algorithm, and Wrist Placement
Fitbit devices use two primary data sources to infer sleep:
- Photoplethysmography (PPG): An optical sensor shines light into the skin and measures how much is reflected back. Blood volume changes with each heartbeat, creating a waveform that allows heart rate and heart rate variability (HRV) to be calculated. Fitbit's PPG sensor sits on the underside of the wristband.
- Accelerometer: A motion sensor that detects wrist movement. Absence of movement is used as a proxy for sleep; movement patterns contribute to wake detection and, in combination with PPG, to stage inference.
From these two signals, Fitbit's proprietary algorithm produces sleep stage classifications. The algorithm itself is not publicly disclosed. Fitbit has not published its methodology, which means independent researchers cannot inspect the logic — only test its outputs against PSG.
Wrist placement introduces a structural constraint that runs through all the accuracy data discussed below. The wrist is not an ideal site for PPG measurement. The skin is thinner over tendons and bone, vascular density varies across the wrist surface, and the oval cross-section of the wrist means a flat sensor cannot form a sealed optical chamber. Motion during sleep — wrist flexion, arm repositioning, finger gripping — also degrades the PPG signal in ways that finger-worn devices are less susceptible to. These are not Fitbit-specific problems; they apply to all wrist-worn optical heart rate sensors.
What Fitbit Gets Right: Total Sleep Time and Sleep Efficiency
The most useful starting point is where Fitbit performs well, because that defines the practical floor of its usefulness as a sleep monitor.
A 2024 study from Brigham and Women's Hospital (Robbins et al.) tested the Fitbit Sense 2 alongside the Oura Ring Gen 3 and Apple Watch Series 8 in 35 healthy adults undergoing simultaneous PSG in a single inpatient night. For binary sleep versus wake detection, all three devices showed sensitivity at or above 95%. Fitbit's sensitivity in this range is consistent with the broader Fitbit validation literature: a 2024 review in the Journal of Sleep Medicine (Park et al.) synthesizing multiple studies found Fitbit sensitivity of 88–99% across device models.
Total sleep time and sleep efficiency — the proportion of time in bed actually spent asleep — showed intraclass correlation coefficients (ICCs) in the acceptable-to-good range in the Robbins et al. study. These are the metrics Fitbit tracks most reliably.
| Metric | Fitbit Performance | Clinical Interpretation |
|---|---|---|
| Sleep vs. wake detection (sensitivity) | 91–95%+ | Comparable to research-grade actigraphy |
| Total sleep time (TST) | ICC ~0.95 range | Acceptable for tracking broad patterns |
| Sleep efficiency | High agreement with PSG | Reliable for trend monitoring |
| Sleep latency | Moderate-to-high agreement | Useful directionally |
| WASO (wake after sleep onset) | Moderate agreement | Use with caution |
| Deep sleep (N3) duration | ICC 0.36 (poor) | Not reliable on a night-by-night basis |
Where Fitbit Falls Short: Sleep Stage Accuracy Breakdown
The core limitation of Fitbit sleep tracking is not sleep detection — it is sleep stage classification. When the algorithm attempts to distinguish between light sleep, deep sleep, and REM, the errors become systematic and clinically meaningful.
In the Robbins et al. 2024 study, the Fitbit Sense 2 significantly overestimated light sleep by approximately 18 minutes (p<0.001) and significantly underestimated deep sleep by approximately 15 minutes (p<0.001) compared to PSG. These are group-level mean differences — they describe the systematic direction of Fitbit's errors, not random noise.
The Park et al. 2024 review of the broader Fitbit validation literature found that this pattern is consistent across studies and device models: light sleep overestimation of 10–38 minutes and deep sleep underestimation of 11–41 minutes. A 2024 systematic review by Schyvens et al. (the Antwerp group) found that the Fitbit Charge 4 showed a mean light sleep overestimation of approximately 37.6 minutes across studies, with deep sleep underestimated by approximately 19.2 minutes.
The more important number is the intraclass correlation coefficient (ICC) for deep sleep. In the Robbins et al. study, Fitbit's deep sleep ICC was 0.36, with a 95% confidence interval of 0.02–0.62. An ICC below 0.50 is generally considered poor for clinical measurement purposes. What this means practically: even if Fitbit's average deep sleep estimate is close to PSG across a group, the agreement on any individual night is unreliable. Two nights with the same actual deep sleep duration could produce substantially different Fitbit readings.
Fitbit's sensitivity to detecting deep sleep epochs was 61.7% in the same study — meaning the device correctly identified deep sleep roughly six times out of ten. The remaining epochs were misclassified, predominantly as light sleep. This is consistent with a mechanistic tendency identified in earlier Fitbit research: a 2019 study by Liang and Chapa-Martell on the Fitbit Charge 2 found that the device dramatically overestimated the probability of staying in deep sleep (94.9% vs. 35.5% by the reference device), suggesting the algorithm treats deep sleep as a stable, prolonged state rather than accurately tracking transitions in and out of it.
| Metric | PSG Reference | Fitbit Error Direction | Fitbit ICC | Fitbit Sensitivity |
|---|---|---|---|---|
| Light sleep (N1+N2) | PSG value | Overestimated ~16–38 min | Moderate | High (but misclassifies deep as light) |
| Deep sleep (N3) | PSG value | Underestimated ~15–41 min | 0.36 (poor) | 61.7% |
| REM sleep | PSG value | Near PSG in some studies | Moderate | Moderate |
| Wake after sleep onset | PSG value | Underestimated across studies | Moderate | Low specificity |
Fitbit vs. Oura Ring: What Two Independent Studies Show
Two independent studies provide the most useful data for comparing Fitbit and Oura Ring sleep tracking accuracy. They used different populations and different device models, so their findings should be read separately rather than merged.
The Robbins et al. 2024 study at Brigham and Women's Hospital (BWH) is the primary source for the direct Fitbit versus Oura Ring comparison. In 35 healthy adults (ages 20–50, 57% female, no sleep disorders), Oura Ring Gen 3 achieved a four-stage Cohen's Kappa of 0.65 — categorized as substantial agreement with PSG. Fitbit Sense 2 achieved a Kappa of 0.55 — moderate agreement. The Oura Ring showed no statistically significant difference from PSG on 7 of 8 nightly sleep metrics. Fitbit differed significantly on two: light sleep (overestimated) and deep sleep (underestimated).
For full context on the Oura Ring's accuracy profile and its own limitations, see the Oura Ring sleep tracking accuracy review. The remainder of this section focuses on what the comparison data tells us about Fitbit.
The Antwerp 2025 study by Schyvens et al. tested six wrist-worn devices in 62 adults, including participants with suspected sleep apnea, undergoing single-night PSG at Antwerp University Hospital. Fitbit Sense achieved a Kappa of 0.42 and Fitbit Charge 5 achieved a Kappa of 0.41 — both moderate agreement. Importantly, this study did not include the Oura Ring. It cannot extend the Fitbit-versus-Oura comparison. The lower Kappa values compared to the BWH study likely reflect both the different population (older, predominantly male, including sleep apnea participants) and the different device models tested.
| Device | Study | Population | Four-Stage Kappa | Deep Sleep vs. PSG |
|---|---|---|---|---|
| Oura Ring Gen 3 | Robbins et al. 2024 (BWH) | 35 healthy adults, 20–50 yrs | 0.65 (substantial) | Not significantly different from PSG |
| Fitbit Sense 2 | Robbins et al. 2024 (BWH) | 35 healthy adults, 20–50 yrs | 0.55 (moderate) | Significantly underestimated (−15 min, p<0.001) |
| Fitbit Sense | Schyvens et al. 2025 (Antwerp) | 62 adults incl. suspected apnea | 0.42 (moderate) | Not significantly different from PSG (mean bias −3.89 min, p=0.249) |
| Fitbit Charge 5 | Schyvens et al. 2025 (Antwerp) | 62 adults incl. suspected apnea | 0.41 (moderate) | Not significantly different from PSG (mean bias −2.19 min, p=0.339) |
A nuance in the Antwerp 2025 data is worth explaining. While Fitbit Sense and Charge 5 achieved lower Kappa values than Oura in the BWH study, the Antwerp data showed that neither Fitbit device had a statistically significant mean difference from PSG for deep sleep or REM totals. This seems to contradict the BWH finding of significant deep sleep underestimation. The difference lies in what is being measured: mean bias (average group-level difference) can be acceptable even when night-to-night variability is high. The Antwerp study's Bland-Altman analysis showed wide limits of agreement, meaning the individual-level reliability problem remains even when the group average is close to PSG.
Why the Finger Outperforms the Wrist for Sleep PPG
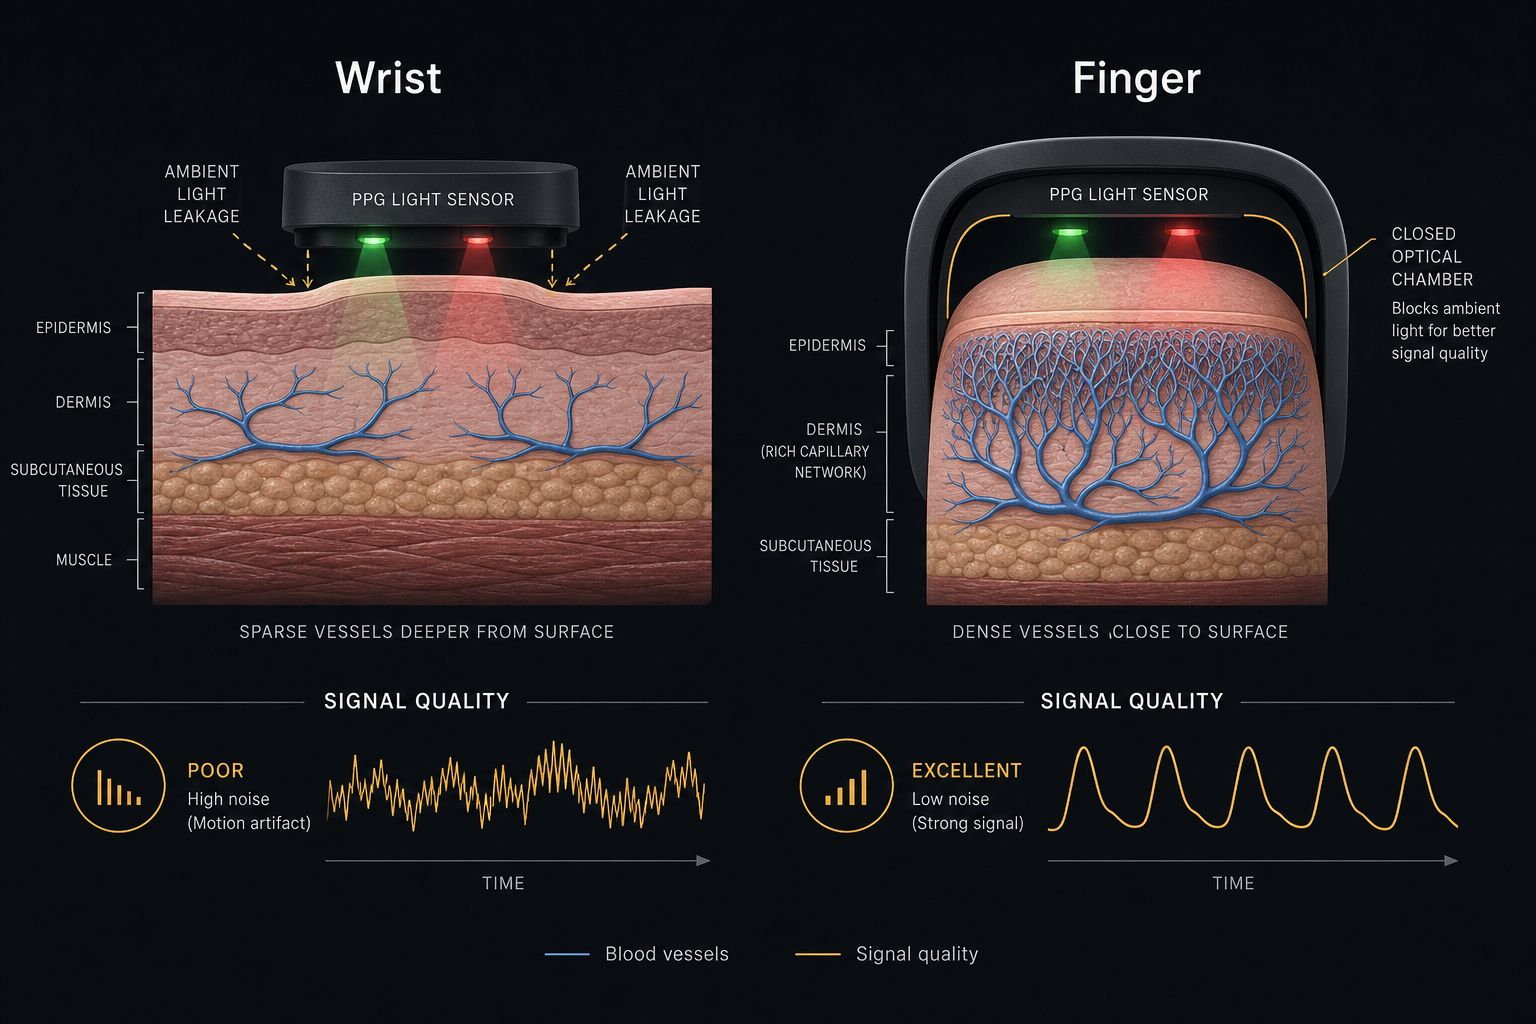
The Kappa gap between Oura Ring and Fitbit is not arbitrary. It has a physiological explanation rooted in where each device takes its measurements.
Three structural factors give finger PPG an advantage over wrist PPG for sleep staging:
- Vascular perfusion density: Fingertips are among the most densely vascularized peripheral sites in the body. The capillary network there produces a stronger, cleaner PPG waveform with higher signal-to-noise ratio. The wrist has lower and more variable vascular density, particularly over tendons and bony prominences, producing a weaker signal that requires more algorithmic correction.
- Closed optical chamber: A ring wraps fully around the finger, forming a sealed optical chamber that blocks ambient light from contaminating the PPG measurement. Wrist-worn sensors sit against a flat surface on an oval limb, creating gaps where external light can enter and degrade signal quality. This is a geometric constraint that no wrist sensor design fully solves.
- Motion artifact during sleep: Wrist movement during sleep — arm repositioning, wrist flexion, hand gripping — introduces motion artifact into the PPG signal. Finger movement during sleep tends to be lower in magnitude and more localized. Because sleep staging relies on detecting subtle HRV patterns, motion artifact that distorts the waveform directly degrades stage classification accuracy.
This is the same principle behind the pulse oximeter clips used in clinical settings: the finger has long been the preferred site for optical measurement of blood oxygen and pulse because the signal quality is consistently higher than at the wrist. Consumer sleep rings apply the same logic to continuous overnight HRV monitoring.
The accuracy difference between Oura Ring and Fitbit in PSG validation studies is therefore not primarily a software or algorithm story — it reflects a hardware constraint that wrist-worn optical sensors cannot fully overcome with algorithmic processing alone.
Population Caveats: Who the Accuracy Data Does and Does Not Apply To
Every accuracy figure cited in this article comes from studies of healthy adults in controlled laboratory settings. This scope limitation matters more for sleep trackers than for most consumer devices, because the people most motivated to monitor their sleep closely are often those with sleep problems.
The Park et al. 2024 review of the Fitbit validation literature cites findings by Menghini et al. showing that in participants with insomnia, Fitbit's measurement bias roughly doubles compared to healthy sleepers. Insomnia disrupts sleep architecture in ways that make stage boundaries harder to detect from peripheral physiological signals — more fragmented sleep, more brief awakenings, altered HRV patterns. The algorithm trained primarily on healthy-adult data performs worse when applied to disrupted sleep.
The Antwerp 2025 study (Schyvens et al.) tested wearables in a population that included participants with suspected sleep apnea and found that agreement between wearable devices and PSG tended to decrease as sleep apnea severity increased. Sleep apnea produces repeated oxygen desaturations and arousal events that fragment sleep architecture in ways that peripheral PPG-based staging cannot reliably track.
Additional population factors that affect Fitbit accuracy include wrist dominant versus non-dominant placement (the Park et al. review notes accuracy varies by wrist), device mode (normal versus sensitive mode affects sensitivity and specificity tradeoffs), and individual physiological variation in PPG signal quality. None of these variables are visible to the user in the Fitbit app.
How to Interpret Your Fitbit Sleep Data: A Reliability Hierarchy
If you already own a Fitbit and want to use its sleep data meaningfully, the research supports a tiered approach based on which metrics have demonstrated reliability and which do not.
| Reliability Tier | Metrics | How to Use Them |
|---|---|---|
| Trust for trend monitoring | Total sleep time, sleep efficiency, sleep latency | These have high ICC values and are within clinically acceptable ranges vs. PSG. Track weekly averages rather than individual nights. |
| Use with caution | WASO (wake after sleep onset), REM sleep duration | Directionally useful but less reliable night-to-night. Consistent multi-week trends may be meaningful; individual night readings less so. |
| Do not treat as precise | Deep sleep (N3) duration, night-by-night stage breakdown | ICC of 0.36 means individual readings have poor concordance with PSG. A low deep sleep reading on a single night may reflect measurement variability rather than actual sleep deprivation. |
The practical implication of this hierarchy is that Fitbit is most useful as a broad behavioral feedback tool — telling you whether you are consistently getting enough sleep, whether your sleep efficiency is low, or whether a change in your schedule is affecting your total sleep time. It is not well-suited for monitoring specific sleep stage composition on a night-by-night basis.
Looking at weekly or monthly averages smooths out the night-to-night measurement variability that the poor deep sleep ICC reflects. If your average total sleep time across two weeks is 5.5 hours, that is a meaningful signal. If your deep sleep reading was 42 minutes on Tuesday versus 71 minutes on Wednesday, that difference may be noise.
Orthosomnia: When Sleep Tracking Data Causes Harm
There is a documented clinical phenomenon called orthosomnia — a term coined by Baron et al. (2017), referenced within the Robbins et al. 2024 paper — in which preoccupation with achieving "perfect" sleep tracker data leads to increased sleep anxiety, behavioral changes based on inaccurate readings, and in some cases unnecessary healthcare utilization.
The poor night-to-night ICC for Fitbit deep sleep creates a specific orthosomnia risk. A user who checks their Fitbit app each morning and sees a low deep sleep number — say, 28 minutes — may reasonably conclude that something went wrong with their sleep. But given an ICC of 0.36, that reading could reflect a genuine reduction in deep sleep, or it could reflect measurement variability. The user has no way to distinguish between the two from the app alone.
This is not a reason to avoid sleep trackers entirely. It is a reason to interpret the data with appropriate calibration — which is what the reliability hierarchy above is designed to support. Total sleep time and sleep efficiency are worth monitoring. Individual deep sleep readings on a single night are not worth losing sleep over.
Fitbit or Oura Ring? A Practical Decision Guide
The accuracy data supports a meaningful difference between the two devices for sleep stage classification. Whether that difference matters for your use case depends on what you are trying to do with the data.
| Consideration | Fitbit | Oura Ring |
|---|---|---|
| Sleep stage accuracy (four-stage Kappa) | 0.41–0.55 (moderate) | 0.65 (substantial) |
| Total sleep time accuracy | High (comparable to Oura) | High |
| Deep sleep ICC | 0.36 (poor) | Better, but not disclosed separately |
| Form factor | Wrist (smartwatch/band) | Finger (ring) |
| Subscription cost | Free for core features; Premium $9.99/month optional | $5.99/month required for full data access |
| Activity tracking | Comprehensive (GPS, ECG on some models, EDA) | Limited compared to Fitbit |
| Smartwatch features | Yes (notifications, payments, apps) | No |
| Best for | Users who want broad sleep + activity monitoring at lower ongoing cost | Users who prioritize sleep stage accuracy and are comfortable with ring form factor and subscription |
Fitbit is a reasonable choice if you want to track broad sleep patterns alongside activity data, prefer wrist form factor, or want to avoid a mandatory monthly subscription. Its total sleep time and sleep efficiency data are reliable enough for behavioral feedback purposes. Its smartwatch features — GPS, EDA stress sensing, ECG on newer models — add utility that the Oura Ring does not offer.
Oura Ring is better suited if sleep stage accuracy is your primary concern and you are comfortable wearing a ring continuously. The Kappa advantage is real and has a mechanistic explanation. However, the primary study supporting that advantage was funded by Oura Ring Inc., and all PSG validation data for both devices comes from single-night, healthy-adult laboratory studies. Neither device has been validated across multi-night, free-living conditions in clinical populations.
For a detailed breakdown of the Oura Ring's accuracy profile, readiness score methodology, and its own study limitations, see the Oura Ring sleep tracking accuracy and features review.
Supports these guides
Spot an error or have clinical feedback?
Because this article covers clinical, medication, or safety information, we use a moderated correction channel instead of open public comments. Let us know if something about “Fitbit Sleep Tracking Review: Accuracy, Sleep Stages, and How It Compares to the Oura Ring” needs a closer look.
Send feedback on this article