Mechanism explainer
Sleep Architecture: NREM and REM Stages Explained
A mechanistic guide to how sleep is organized each night — covering the biology of N1, N2, N3, and REM stages, how their distribution shifts across sleep cycles, what each stage does in the body and brain, and how aging, common conditions, and consumer trackers affect what you actually measure.
What Sleep Architecture Means — and Why It Matters Beyond Hours
Most conversations about sleep start and end with duration. Eight hours is the benchmark; anything less invites concern. But duration is only one dimension of sleep quality. The other — and arguably more revealing — dimension is sleep architecture: the structured sequence, proportion, and timing of distinct sleep stages across a night.
Two people can both sleep eight hours and have radically different nights. One person cycles through deep restorative stages in the right proportions at the right times. The other fragments repeatedly, spending most of the night in shallow sleep. The number on the clock looks identical. The biology inside is not.
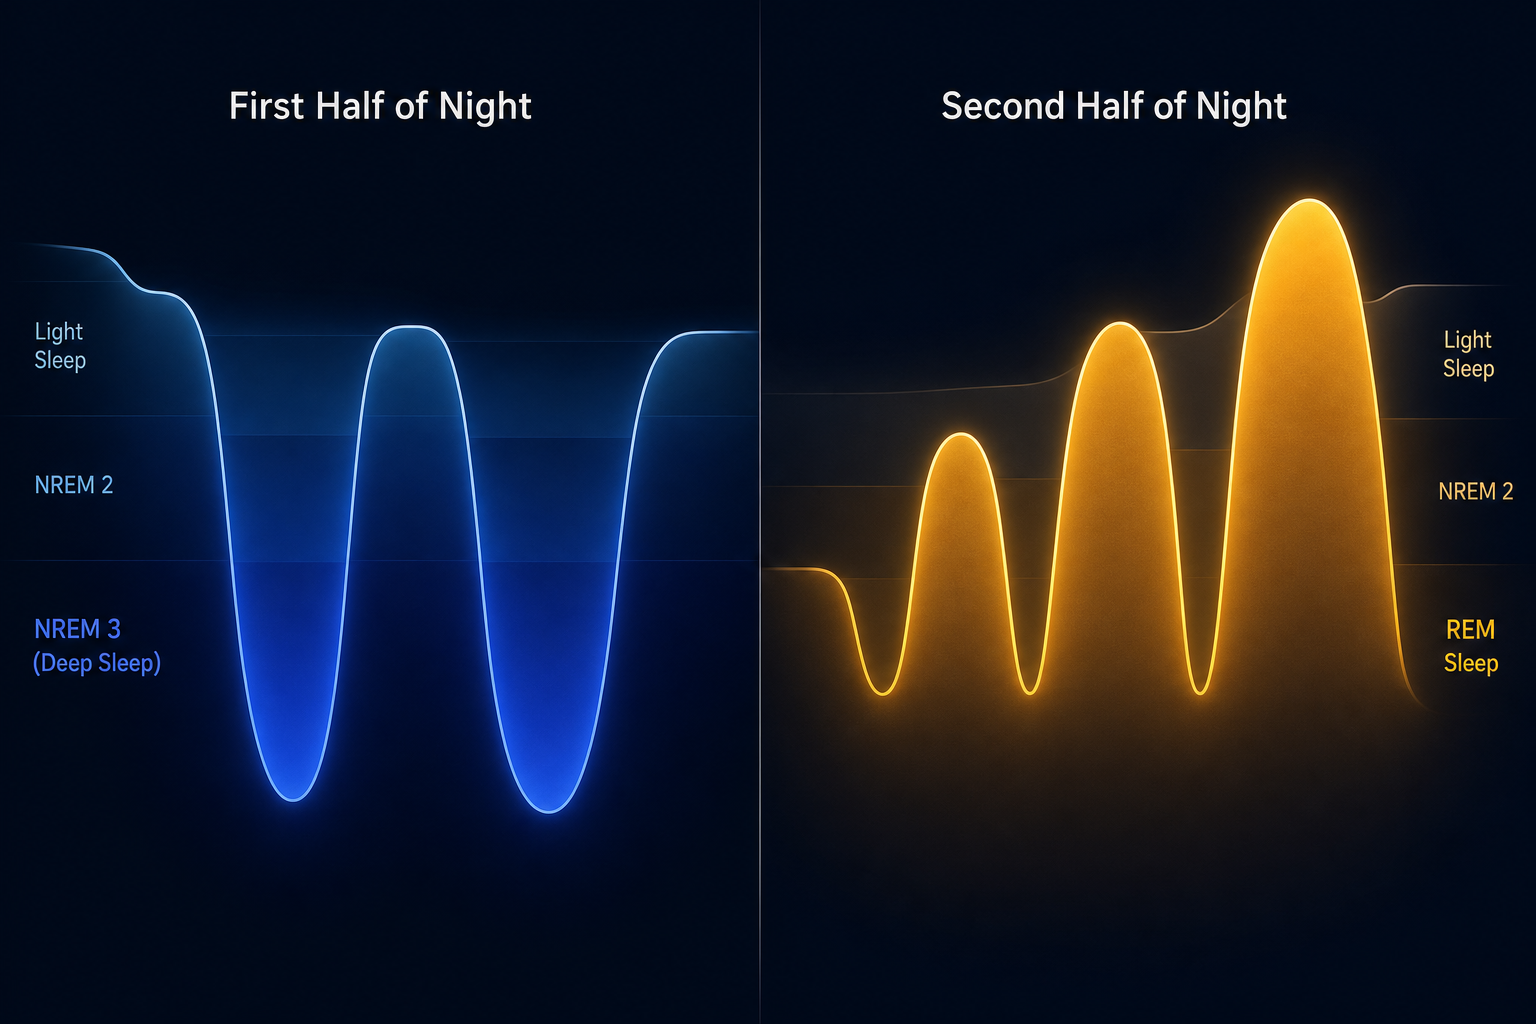
Sleep architecture is typically visualized as a hypnogram — a graph that plots sleep stage on the vertical axis against time on the horizontal axis. A healthy hypnogram looks like a series of descending and ascending waves, with the deepest valleys concentrated in the first half of the night and progressively shallower, more active patterns filling the second half. That asymmetry is not incidental. It reflects a precise biological program.

While how many hours adults actually need is a separate and well-studied question, this article focuses on what happens inside those hours — the internal organization that determines whether sleep is genuinely restorative or merely prolonged.
The Four Sleep Stages: Signatures, Proportions, and What They Feel Like
Sleep is divided into two broad categories: non-rapid eye movement (NREM) sleep and rapid eye movement (REM) sleep. Within NREM, the American Academy of Sleep Medicine (AASM) recognizes three stages — N1, N2, and N3 — updated from the older four-stage classification (Stages 1, 2, 3, and 4) in its 2007 manual revision. If you have used an older sleep tracker or read pre-2007 literature, you may encounter the legacy numbering; the current three-stage NREM framework is the standard today.
| Stage | EEG Signature | Typical % of Night | Duration Pattern | Key Characteristic |
|---|---|---|---|---|
| N1 | Theta waves (4–8 Hz) | 2–5% | 1–7 minutes per episode | Transition from wakefulness; easily disrupted; hypnic jerks common |
| N2 | Sleep spindles + K-complexes | 45–55% | Sustained across all cycles | The night's workhorse stage; sensory gating; memory processing |
| N3 (SWS) | Delta waves (0.5–4 Hz) | 10–25% | Long in cycles 1–2; shortens thereafter | Deepest NREM; hardest to wake from; sleep inertia if disrupted |
| REM | Near-wake mixed frequency | 20–25% | Brief in cycle 1; lengthens across cycles 3–5 | Skeletal muscle atonia; vivid dreaming; emotional memory processing |
N1 is the threshold — a light, unstable state that occupies only a few percent of the night. Most people experience it as the sensation of drifting, occasionally punctuated by a sudden muscle twitch (a hypnic jerk) that pulls them back to wakefulness.
N2 is where adults spend the plurality of their night — roughly half of total sleep time. It is characterized by two distinctive EEG events: sleep spindles (brief, powerful bursts of thalamocortical activity lasting 0.5 to 3 seconds, occurring every 3 to 6 seconds) and K-complexes (sharp high-amplitude waves that help suppress arousal responses to external stimuli). Despite being labeled "light" sleep in many consumer apps, N2 is far from passive.
N3 — also called slow-wave sleep (SWS) or deep sleep — is defined by high-amplitude delta waves. It is the hardest stage to wake someone from, and if you are roused from it, the resulting grogginess and disorientation is called sleep inertia. It is also the stage most consumer trackers have the most difficulty measuring accurately.
REM sleep presents a paradox: the brain is nearly as active as during wakefulness, yet the body is effectively paralyzed. Skeletal muscle atonia — a near-complete suppression of voluntary muscle movement — prevents the body from acting out the vivid, emotionally rich dreams that characterize this stage. The first REM episode of the night is brief, sometimes less than 10 minutes. By the final cycle, it can stretch to an hour.
How Stage Distribution Shifts Across the Night
Knowing what each stage is matters less than understanding how they are arranged. Sleep is not a random shuffle of stages — it follows a consistent, predictable temporal pattern that most people never learn about, even though it explains most of what makes sleep either restorative or inadequate.
A complete sleep cycle — one pass through NREM stages followed by REM — averages 90 to 110 minutes. Most adults complete 4 to 6 cycles per night. The first cycle is often shorter (around 70 to 100 minutes); later cycles tend to run longer.
The critical insight is the asymmetry between the first and second halves of the night:
- Cycles 1 and 2 (roughly the first 3 hours): N3 slow-wave sleep dominates. Each early N3 episode can last 20 to 40 minutes. REM in the first cycle is brief — often less than 10 minutes.
- Cycles 3 through 5 (the second half of the night): N3 episodes shorten dramatically and may disappear altogether in the final cycles. REM episodes lengthen progressively — the final REM episode can reach 60 minutes or more.
This front-loading of deep sleep and back-loading of REM is not a quirk — it is the architecture's core design. The body prioritizes physical restoration and waste clearance in the early night, then shifts to memory consolidation and emotional processing in the later hours.
This timing asymmetry has a practical implication that most people underappreciate: cutting sleep short by even 90 minutes disproportionately reduces REM, because the longest REM episodes occur in the final cycles. Conversely, going to bed very late compresses the time available for early N3 episodes, since the body's slow-wave drive is highest at the start of the night regardless of clock time.
What Each Stage Is Actually Doing: The Biology of NREM and REM
The stages are not just different depths of unconsciousness. Each serves functions that the others cannot substitute for. Losing deep sleep has different consequences than losing REM, and neither can be fully recovered by simply sleeping longer in the other stage.
N2: Memory Consolidation and Sensory Gating
Sleep spindles — the defining feature of N2 — are generated by GABAergic neurons in the reticular nucleus of the thalamus. These brief bursts of synchronized neural activity inhibit thalamocortical projection neurons, effectively muffling the brain's response to external stimuli and maintaining sleep continuity.
Beyond sensory gating, spindles are linked to synaptic plasticity — the strengthening and refinement of neural connections that underlies learning. Research has associated spindle density with consolidation of both declarative memory (facts, events) and procedural memory (motor skills, learned sequences). K-complexes contribute to this process and also serve as arousal-suppression events, protecting sleep from transient disturbances.
N3: Glymphatic Clearance, Growth Hormone, and Physical Repair
Slow-wave sleep is where the body attends to its most fundamental maintenance tasks. Three functions stand out:
- Glymphatic activation: During N3, the brain's interstitial spaces enlarge, allowing cerebrospinal fluid to flow through perivascular spaces — channels surrounding blood vessels — assisted by AQP4 water channels on astrocyte end-feet. This flow flushes out metabolic waste products including amyloid-beta and tau, proteins associated with neurodegenerative disease.
- Growth hormone pulse: The largest single pulse of growth hormone secretion each day is tightly coupled to the first N3 episode of the night. This pulse drives tissue repair, muscle synthesis, and metabolic regulation. As N3 declines with age, so does this growth hormone pulse.
- Immune function and tissue repair: N3 is associated with cytokine activity and cellular repair processes. Consistent N3 disruption is linked to impaired immune responses and slower physical recovery.
REM: Emotional Memory, Procedural Learning, and Neural Housekeeping
REM sleep is neurologically the most active stage. Brain metabolism increases by approximately 20% relative to NREM, and blood flow rises in the thalamus and primary visual, motor, and sensory cortices. Acetylcholine — a neurotransmitter associated with cortical arousal and attentional processing — is elevated, driving the characteristic cortical desynchrony of REM.
The functional contributions of REM include:
- Emotional memory processing: REM appears to selectively consolidate emotionally salient memories while dampening the affective charge attached to them — a process sometimes described as "therapy while you sleep." Disrupted REM is associated with difficulty regulating emotional responses and increased reactivity to negative stimuli.
- Procedural memory integration: Motor skill learning and pattern recognition tasks show REM-dependent consolidation, particularly for complex or abstract rule extraction.
- Muscle atonia: The near-complete suppression of voluntary muscle activity during REM prevents the body from acting out dream content. Failure of this atonia mechanism is the defining feature of REM sleep behavior disorder.
How Sleep Architecture Changes With Age
Sleep architecture is not static across adulthood. It changes in measurable, well-documented ways from young adulthood through old age — and understanding these changes helps contextualize why older adults often feel their sleep is lighter and less restorative, even when their total sleep time has not changed dramatically.
| Parameter | Direction of Change | Rate / Magnitude | Notes |
|---|---|---|---|
| N3 slow-wave sleep (men) | Declines | ~1.7% per decade | SIESTA database; women show no significant age-related SWS decline |
| N3 slow-wave sleep (women) | Relatively stable | No significant age-related decline | Women maintain SWS longer than age-matched men |
| REM sleep | Declines | ~0.6% per decade, ages 19–75 | Linear decline across adulthood |
| WASO (wake after sleep onset) | Increases | ~10 min per decade, ages 30–60 | Plateaus after age 60 in healthy older adults |
| Circadian timing | Advances | Earlier sleep and wake times | Phase advance; common in adults over 60 |
| Growth hormone pulse | Declines | Parallel to N3 decline | Tightly coupled to first N3 episode |
Slow-wave sleep peaks in early childhood and drops sharply during adolescence — by ages 10 to 20, it diminishes by more than 60%. The adult trajectory continues this decline, though at a slower rate. In some older adults, N3 may be nearly absent from later cycles entirely.
The sex difference in N3 decline is clinically meaningful. Men lose approximately 1.7% of slow-wave sleep per decade; women maintain SWS relatively well until the menopausal transition, when hormonal changes — particularly declining estrogen and progesterone — are associated with increased sleep fragmentation, more frequent awakenings, and reduced overall sleep quality. This is covered in detail in the perimenopause sleep condition content.
Importantly, most of these changes stabilize after age 60 in healthy older adults. The trajectory is not one of indefinite decline — architecture reaches a new, lower-amplitude equilibrium in late life, even if it never returns to the deep, consolidated sleep of young adulthood.
What Disrupts Sleep Architecture: Insomnia, Sleep Apnea, Alcohol, and More
Several common conditions and substances alter sleep architecture in ways that are clinically distinct from one another. Understanding these patterns helps explain why different sleep problems feel different — and why they require different approaches.
| Condition / Substance | Primary Architecture Effect | Mechanism |
|---|---|---|
| Insomnia | Increased WASO; fragmented NREM; cortical hyperarousal during sleep | Persistent hyperarousal prevents full descent into N3; EEG during NREM resembles wakefulness more than normal sleep |
| Obstructive sleep apnea | Reduced N3 and REM; frequent micro-arousals | Airway collapse is more likely in deeper sleep states; arousals prevent sustained N3 and REM |
| Alcohol | Suppressed REM in first half; REM rebound in second half; increased WASO | Alcohol's sedating effect initially suppresses REM; as it metabolizes, REM rebounds with fragmented, lighter sleep |
| Benzodiazepines | Increased N2; reduced N3 and REM; raised arousal threshold in deep stages | Enhance GABAergic inhibition; produce sedation but impair the architecture of restorative sleep |
| Depression | Shortened REM latency; increased total REM; reduced N3 | REM onset is earlier and more abundant, but not in the emotionally regulated, restorative sense; N3 is often compressed |
Insomnia deserves particular attention here. People with insomnia often report feeling like they were "never really asleep" — and EEG data supports this subjective experience. Brain waves during NREM sleep in people with chronic insomnia show patterns that more closely resemble wakefulness, with faster activity persisting through stages that should be characterized by slow, synchronized oscillations. This cortical hyperarousal is a neurophysiological signature, not simply a misperception.
For the full clinical picture of insomnia — including diagnostic criteria, contributing factors, and first-line treatment — see the detailed article on chronic insomnia disorder. This article covers only the architecture-level disruption.
What Consumer Sleep Trackers Actually Measure — and Where They Fall Short
If you own a sleep tracker, you have probably seen a nightly breakdown of your deep sleep and REM time. Understanding how those numbers are generated — and how accurate they actually are — is essential for interpreting them without anxiety.
The Gold Standard: Polysomnography
Clinical sleep staging is performed using polysomnography (PSG) — a multi-channel recording that captures EEG (brain waves), EOG (eye movements), EMG (muscle activity), ECG (heart rhythm), and pulse oximetry (blood oxygen), scored in 30-second epochs by trained technicians. PSG is the only measurement method that directly captures the EEG signatures — delta waves, sleep spindles, K-complexes, REM's mixed-frequency low-amplitude pattern — that define each stage.
Consumer wearables do not have EEG. They infer sleep stages from movement (accelerometry), heart rate, heart rate variability, skin temperature, and sometimes blood oxygen — all of which correlate with sleep stages but are not the same as directly measuring them.
What the Accuracy Data Actually Shows
A 2024 validation study by Robbins and colleagues (n=35, conducted at Brigham and Women's Hospital) compared three consumer devices — Apple Watch Series 8, Fitbit, and Oura Ring Gen3 — against simultaneous PSG in a single-night inpatient protocol.
The results were instructive:
- All three devices detected sleep versus wake with ≥95% sensitivity — a reasonable result for the binary question of whether someone is asleep.
- Concordance with PSG for deep sleep and REM was poor across all devices: intraclass correlation coefficients (ICC) ranged from 0.13 to 0.36 for deep sleep and 0.13 to 0.37 for REM sleep.
- Apple Watch Series 8 underestimated deep sleep by an average of 43 minutes (p<0.001) and overestimated light sleep by 45 minutes — a substantial systematic bias.
- Fitbit underestimated deep sleep by approximately 15 minutes on average.
- Oura Ring Gen3 showed no statistically significant group-level difference from PSG for deep sleep or REM — the best performance among the three devices — but individual-level ICC remained poor, meaning the device's accuracy at the individual night level was still limited.
| Device | Sleep/Wake Sensitivity | Deep Sleep ICC vs. PSG | REM ICC vs. PSG | Deep Sleep Bias |
|---|---|---|---|---|
| Apple Watch Series 8 | ≥95% | 0.13–0.36 | 0.13–0.37 | Underestimated by ~43 min |
| Fitbit | ≥95% | 0.13–0.36 | 0.13–0.37 | Underestimated by ~15 min |
| Oura Ring Gen3 | ≥95% | No significant group-level difference | No significant group-level difference | No significant group-level bias |
An ICC of 0.13 to 0.37 for deep sleep and REM means that, at the individual level, a wearable's stage estimate on any given night may deviate substantially from what PSG would show. The group-level averages may be closer to PSG, but your specific deep sleep number on a specific night is an approximation with meaningful uncertainty attached.
How to Use This Knowledge: Interpreting Your Sleep Data Without Anxiety
Understanding sleep architecture — and its measurement limitations — changes how you should read your tracker data. The goal is not to stop using your device but to interpret it at the right resolution.
- Interpret trends over weeks, not individual nights. Night-to-night variability in deep sleep and REM is normal. A single low deep sleep score is not a crisis — it may reflect measurement error, a mild stressor, a late meal, or simply normal biological variation.
- Understand what your tracker cannot see. Consumer devices infer stages from heart rate and movement, not brain waves. A device that shows you had "only 45 minutes of deep sleep" may be underestimating by 15 to 43 minutes based on available validation data.
- Use architecture knowledge to identify patterns worth investigating. Consistently fragmented sleep, very low REM across many weeks, or a pattern of waking in the second half of the night are worth discussing with a clinician — not because your tracker is clinically accurate, but because these patterns correspond to known disruption mechanisms.
- Avoid orthosomnia. Orthosomnia — sleep anxiety driven by excessive focus on tracker data — is a real phenomenon. If checking your sleep score is causing distress or changing your behavior in ways that feel compulsive, the tracker is working against you. Sleep architecture is a biological program that runs whether you monitor it or not.
- Recognize what trackers are actually good at. Sleep/wake detection is reliable (≥95% sensitivity). Tracking long-term trends in total sleep time, sleep timing consistency, and resting heart rate variability can provide genuinely useful signals. These are the tracker's strengths — not precise stage classification.
If your tracker data has prompted questions about your sleep quality, the most productive next step is usually behavioral rather than diagnostic. The evidence-based practices that protect sleep architecture — consistent sleep timing, limiting alcohol before bed, managing light exposure, and addressing sleep-disrupting habits — are covered in detail in the guide to sleep hygiene fundamentals and an evidence-based bedtime routine.
Supports these guides
Spot an error or have clinical feedback?
Because this article covers clinical, medication, or safety information, we use a moderated correction channel instead of open public comments. Let us know if something about “Sleep Architecture: NREM and REM Stages Explained” needs a closer look.
Send feedback on this article