
The most common mistake in reading sleep HRV is also the most understandable one: you wake up, open the app, see one number, and try to make it confess. Was it the late workout? The glass of wine? The stressful meeting? The bad dream you barely remember?
Most of the time, that single number is not ready to answer. Nightly HRV is useful only after it is placed against your own recent pattern. A 2- to 4-week baseline gives the number somewhere to live; without it, “low” and “high” are mostly guesses dressed up as precision. Short-term drops of about 10% to 20% can happen inside normal variance, while a sustained drop of about 20% to 30% or more across 3 to 5 consecutive days is the point where it starts to deserve recovery attention rather than casual curiosity.[1]

Your Baseline Comes Before Your Score
HRV, or heart rate variability, is the variation in timing between heartbeats. Sleep trackers usually turn that into a nightly recovery-style number, often using measurements taken while you are asleep. The tempting shortcut is to treat that number like a grade. The better shortcut is to treat it like a weather reading from one sensor: meaningful only when you know what is normal for that sensor, in that place, during that season of your life.
That is why population HRV charts are usually less helpful than they look. Age, sex, fitness, sleep timing, illness, medication, measurement method, and individual physiology all affect HRV. About 20% of baseline variance has been attributed to genetics, which is enough to make “good HRV for your age” a shaky tool for judging your own recovery.[1]
For a tracker owner, the practical question is narrower: is tonight meaningfully different from my recent normal? That recent normal should be built from repeated nights, not one impressive high or one discouraging low. A 2- to 4-week window is long enough to include ordinary variation but short enough to still reflect your current life: the job you have now, the training load you are carrying now, the bedtime habits you actually keep now.[1]
| What you see | How to read it | What to do next |
|---|---|---|
| One low night | Usually weak evidence by itself | Notice it, but do not rewrite the day around it |
| A 10-20% drop from your baseline | Often normal short-term variance | Check context and wait for persistence |
| A 20-30%+ drop for 3-5 consecutive days | A stronger recovery signal | Reduce strain, protect sleep, and watch the trend |
| A jagged 2-4 week graph | Possible habit-pattern signal | Look at alcohol, sleep timing, and activity consistency |
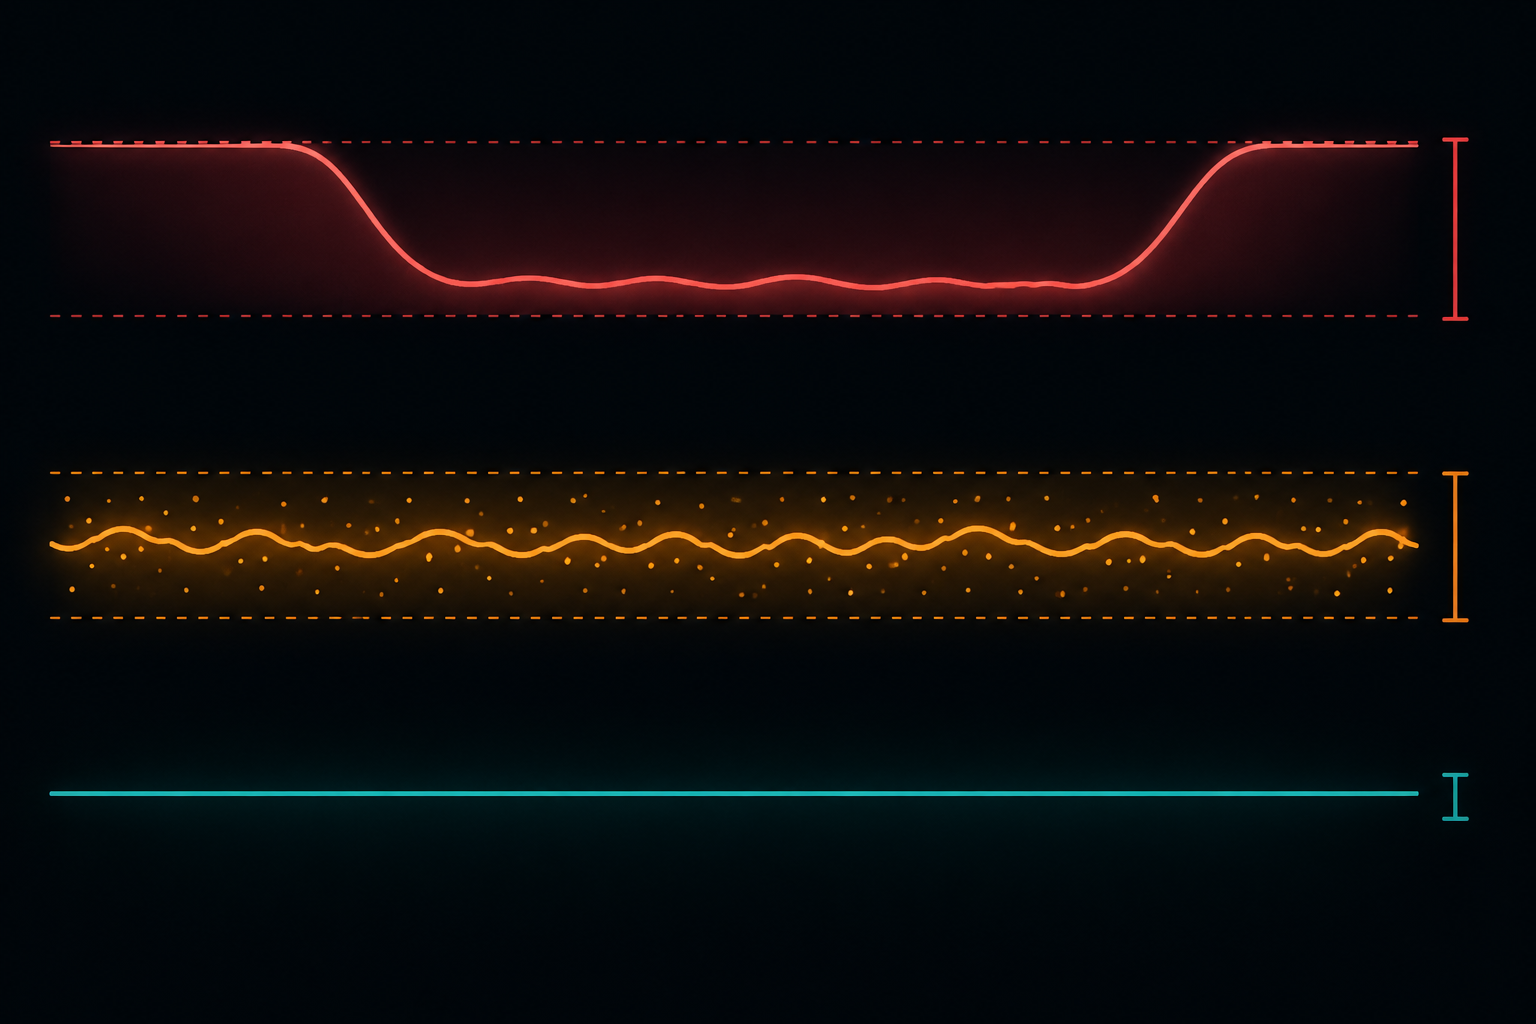
This does not mean you should ignore HRV until a spreadsheet is satisfied. It means the first reading task is comparison. If your baseline is 60 milliseconds and you wake up at 54, that is a 10% drop. It may feel dramatic because the app changed color, but the physiology may still be inside ordinary noise. If your baseline is 60 and you spend four nights around the low 40s, the pattern is different. Now the issue is not one bad dot. It is a short run of lower-than-usual recovery.
When to Ignore the Number, and When to Respond
A low HRV night is not automatically a failed recovery night. It can follow hard training, poor sleep, alcohol, travel, late meals, stress, or nothing obvious enough to identify. The problem is not that these factors are irrelevant. The problem is that one nightly value cannot reliably separate them. It gives you a clue, not a cause.
The cleanest reading routine starts with three questions:
- Is tonight’s HRV meaningfully below my own 2- to 4-week baseline?
- Is the drop larger than ordinary 10% to 20% night-to-night movement?
- Has the drop persisted for 3 to 5 consecutive days?
If the answer stops at the first question, the number is mostly a note. If it reaches the second, it is worth watching. If it reaches the third, it is worth changing something. That change does not need to be dramatic. The point is to reduce unnecessary strain while the trend is suppressed: keep the workout easier, avoid stacking another late night onto the last one, stop treating caffeine and alcohol timing as harmless details, and give sleep the boring protection it usually needs.
The 20% rule is useful because it prevents two opposite mistakes. One mistake is overreacting to every dip and letting the app set the emotional tone of the morning. The other is dismissing a real multi-day change because no single night looked catastrophic. A sustained 20% to 30% or greater decline over 3 to 5 days is not a diagnosis, and it does not tell you whether the cause is training load, illness, sleep debt, stress, alcohol, or something else. It does say the signal has moved from “interesting” to “worth respecting.”[1]
This is also where readiness scores can become too confident. A color-coded dashboard has to decide what kind of morning you are having. Your body does not. The more useful interpretation is quieter: one low night gets logged; several low nights change the plan.
The Shape of the Graph May Matter More Than the Average
Once you stop chasing one number, the next thing to notice is the shape of the line. A stable HRV trend with small nightly wiggles tells a different story from a jagged graph that spikes and crashes across the same 2- to 4-week window. The average may look acceptable in both cases. The pattern does not.
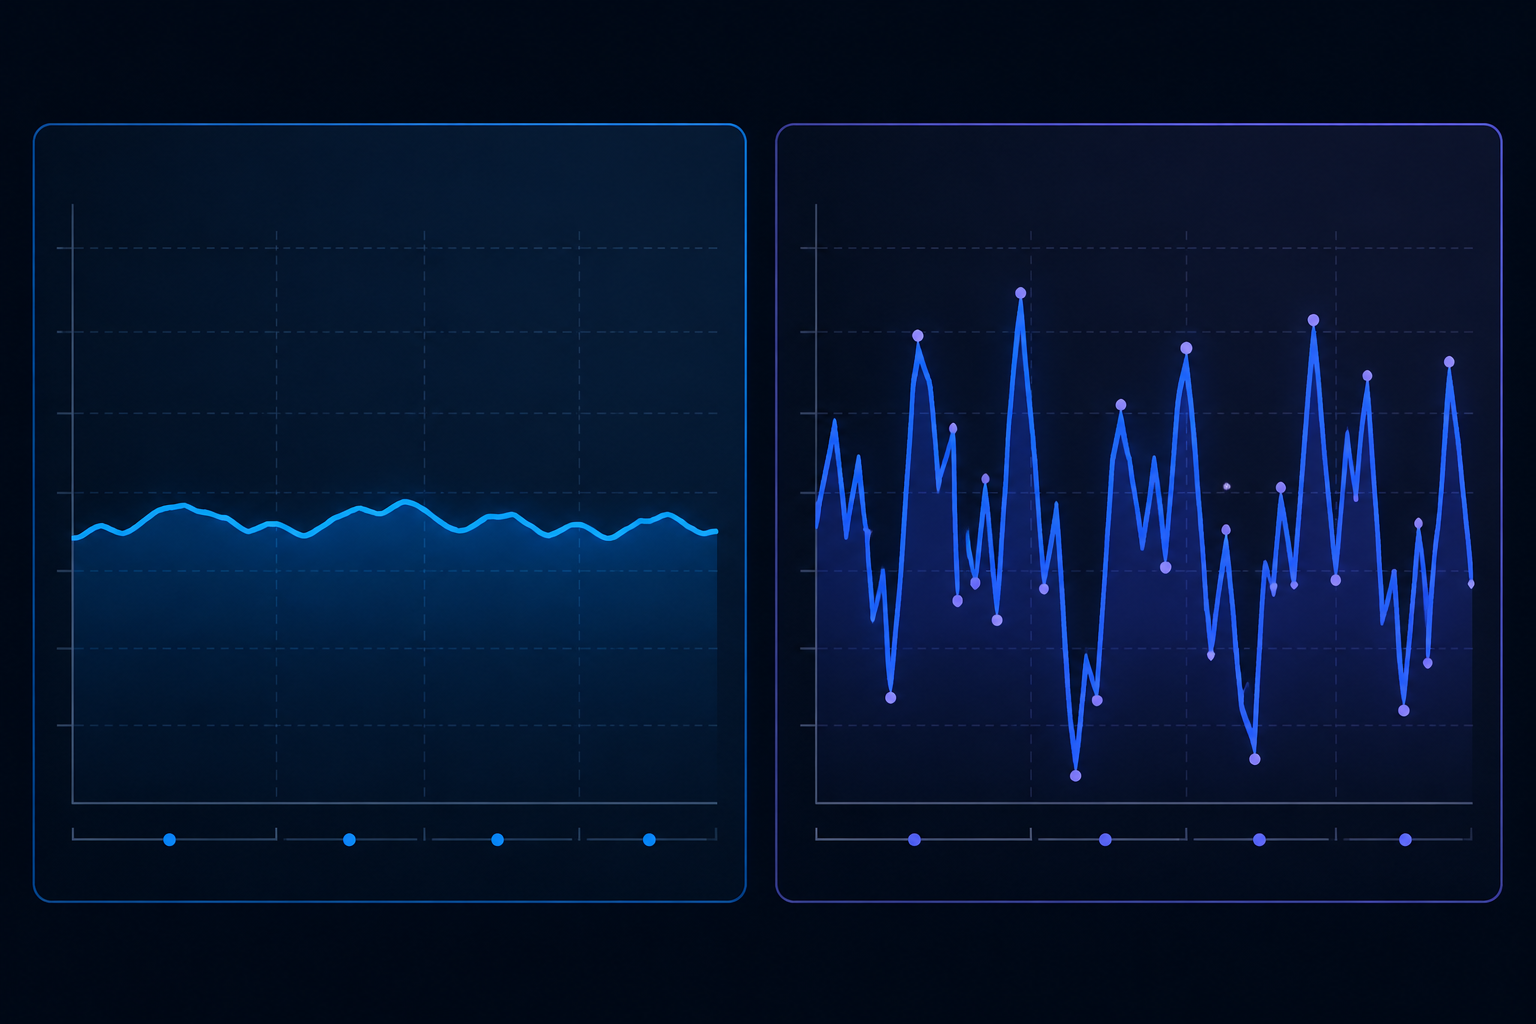
That is the most interesting part of the 2026 Grosicki et al. paper on sleep HRV. The study analyzed nearly 2 million nights from more than 21,000 individuals and focused on HRV coefficient of variation, or HRV-CV: a measure of how variable someone’s HRV is across nights. The key shift is away from asking only “what is the mean HRV?” and toward asking “how unstable is the pattern?” The published abstract and available analyses report that HRV-CV, more than mean HRV, reflected behavioral patterns and varied by age and sex.[2]
That matters because many tracker owners are trained to celebrate higher HRV and fear lower HRV. Variability adds another layer. A person can have an average HRV that seems fine, yet show a highly uneven pattern across nights. In the Grosicki-related analysis, that jaggedness was associated with behaviors such as alcohol use, irregular sleep timing, and inconsistent physical activity.[1][2]
The boundary is important: this does not prove that every jagged HRV graph is caused by those behaviors, and the full Grosicki paper is not freely available in full text. The available evidence supports a more careful conclusion: night-to-night instability appears to carry behavioral information, and it may be more actionable than a single average value. If your HRV line looks chaotic, the better question is not “which exact night ruined me?” It is “what in my routine keeps changing?”
The answer may be ordinary. Bedtime moves by two hours across the week. Alcohol appears on scattered nights. Training alternates between inactivity and ambitious catch-up sessions. Sleep duration varies because wake time is fixed but bedtime is negotiable. None of these has to be a moral problem to become a physiological pattern. A smoother HRV graph is often built from less dramatic habits.
A Weirdly High HRV Night Can Be Noise Too
Low HRV gets most of the attention, but unusually high HRV should not automatically be treated as a victory lap. Measurement method matters. Marco Altini’s technical discussion of nighttime HRV argues that consumer wearables are most useful when they average multiple 5-minute RMSSD windows across the full sleep period, rather than leaning too heavily on a single short segment. He also notes a counterintuitive artifact problem: movement can inflate HRV readings rather than simply lower them.[3]
Altini is not a detached observer; he is the founder of HRV4Training and has advised Oura on data science. That context is worth naming. The methodological point is still useful, especially because it is consistent with a broader principle of sleep tracking: repeated, clean, within-person measurements are more trustworthy than isolated extremes. A suspiciously high night after restless sleep may be an artifact, not evidence that your nervous system held a private recovery festival while you tossed around.
For interpretation, this means you should distrust both kinds of outlier. One unusually low night may not be a warning. One unusually high night may not be a reward. The trend earns more attention than the spike.
Do Not Compare HRV Across Devices as if the Numbers Match
Even when devices are measuring something real, they may not be measuring it the same way. Terra Research’s 93-day wearable comparison reported a gap between Oura and Apple Watch HRV values because the devices used different HRV metrics, including RMSSD and SDNN.[4]
That is why switching devices can make your HRV look as if your body changed when the measurement system changed. If you move from one ring, watch, or band to another, rebuild the baseline. Do not compare last month’s Oura number with this month’s Apple Watch number and search for a physiological explanation before ruling out a methodological one.
The better validation question is not “are wearables fake?” Some are good enough to be useful for trends. In a 2025 validation study of nocturnal resting heart rate and HRV in consumer wearables, reported concordance correlation coefficient values against ECG were 0.99 for Oura Ring 4 and 0.94 for WHOOP 4.0.[5] That supports cautious use for overnight trend tracking. It does not make every app interpretation equally sound, and it does not make numbers interchangeable across brands.
A Calm Routine for Reading Sleep HRV
If you want HRV to help rather than haunt you, make the reading process smaller and more consistent. Open the app, but do not let the first number be the whole story.
- Compare tonight only with your own recent 2- to 4-week baseline.
- Treat a 10% to 20% drop as common short-term movement unless it persists.
- Respond when HRV is down about 20% to 30% or more for 3 to 5 consecutive days.
- Look at whether the graph is smooth or jagged across weeks.
- Rebuild your baseline after changing devices, algorithms, or major routines.
The response does not need to be elaborate. Prioritize sleep timing, reduce training intensity if you have been pushing, avoid alcohol while the trend is suppressed, and give yourself a few nights before deciding the pattern has resolved. If symptoms, illness, or medical concerns are present, HRV should not be the deciding authority; it is supporting context.
The useful version of sleep HRV is not a daily verdict. It is a trend line that becomes meaningful only after it has had enough nights to show you what is normal, what is noisy, and what is persistent enough to change tomorrow’s plan.
References
- HRV Meaning, Ranges, and Trends, Ikigai Health Institute
- Heart rate variability coefficient of variation during sleep as a digital biomarker that reflects behavior and varies by age and sex, American Journal of Physiology-Heart and Circulatory Physiology, 2026
- What you need to know about Heart Rate Variability (HRV) data collected during the night, Marco Altini
- How HRV Actually Works, Terra Research, 2025
- Validation of nocturnal resting heart rate and heart rate variability in consumer wearables, Physiological Reports, 2025
Comments
Join the discussion with an anonymous comment.