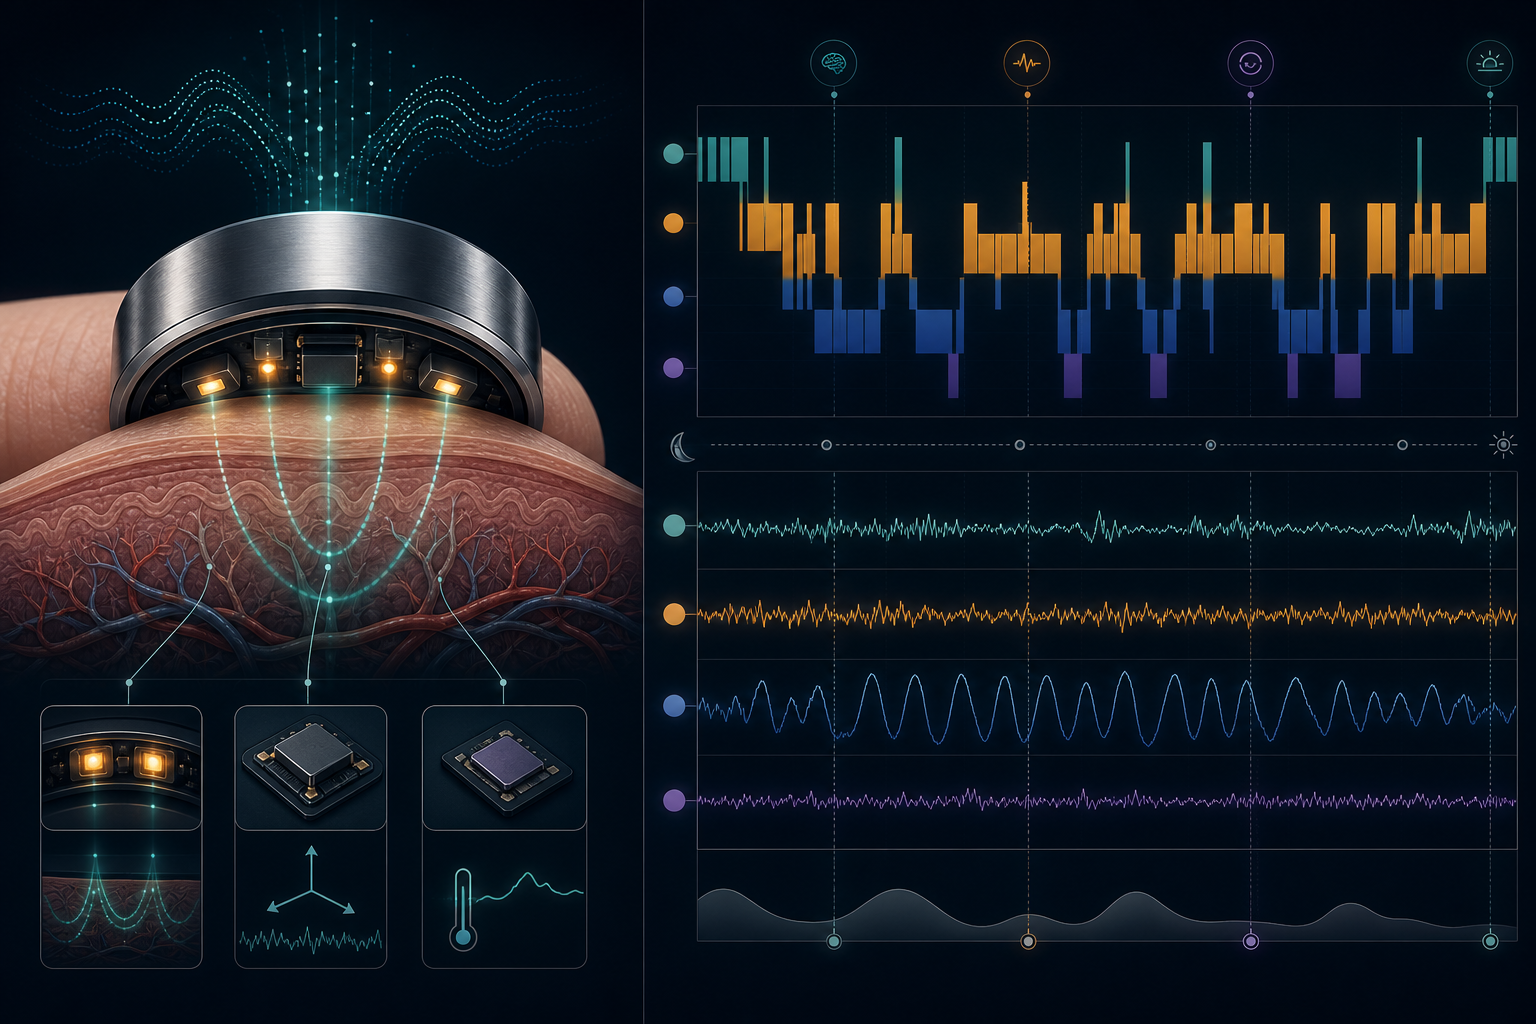
Mechanism explainer
How Accurate Is the Oura Ring for Sleep Tracking? A Data-Driven Analysis of PSG Validation Studies
This article provides an evidence-based analysis of Oura Ring sleep tracking accuracy, drawing on peer-reviewed polysomnography validation studies from Brigham & Women's Hospital and the University of Tokyo. It examines epoch-by-epoch performance, head-to-head comparisons with Apple Watch and Fitbit, and the critical distinction between strong group-level accuracy and weaker individual-level concordance for deep and REM sleep.
Introduction: The Accuracy Question for Evidence-Verification Readers
If you are reading this, you have likely moved past the "should I buy a sleep tracker?" stage and into the harder question: "Can I trust the numbers it gives me?" That is the right question to ask. The consumer wearable market is flooded with sleep scores, stage breakdowns, and readiness metrics, but the underlying data quality varies enormously between devices — and between the claims manufacturers make versus what independent validation studies actually show.
This article is a focused, data-driven analysis of Oura Ring sleep tracking accuracy, built around two peer-reviewed polysomnography (PSG) validation studies: one from Brigham & Women's Hospital (Robbins et al., 2024, published in Sensors) and another from the University of Tokyo (Svensson et al., 2024, published in Sleep Medicine). We will walk through epoch-by-epoch performance, head-to-head comparisons with the Apple Watch and Fitbit, and — most critically — the gap between strong group-level accuracy and weaker individual-level concordance for deep and REM sleep.
The core thesis is straightforward: Oura is the most validated consumer sleep tracker on the market, with peer-reviewed data showing 76–79.5% sensitivity for individual sleep stages and >94% sensitivity for sleep vs. wake detection. But those numbers come with important caveats about what they mean for you on any given night. If you are looking for a broader overview of Oura Ring features, subscription pricing, and general usability, see our full Oura Ring product review. This piece is about the data.
What Is Polysomnography (PSG) and Why Is It the Gold Standard?
Before diving into the numbers, it is worth understanding the benchmark. Polysomnography is the clinical gold standard for sleep staging. A PSG study records at least three physiological signals simultaneously:
- Electroencephalography (EEG): Measures electrical brain activity. Different brainwave frequencies (delta, theta, alpha, beta) define sleep stages N1, N2, N3 (deep sleep), and REM.
- Electrooculography (EOG): Tracks eye movements, which are essential for identifying REM sleep.
- Electromyography (EMG): Measures muscle tone, which drops significantly during REM sleep.
A trained sleep technician scores each 30-second epoch of the night as wake, N1, N2, N3, or REM according to the American Academy of Sleep Medicine (AASM) scoring manual. This is the reference standard against which all consumer wearables are measured.
Consumer wearables like the Oura Ring cannot measure brainwaves or eye movements. They rely on surrogate signals: photoplethysmography (PPG) for heart rate and heart rate variability, an accelerometer for movement, and — in newer generations — a temperature sensor. The device's algorithm then infers sleep stages from these indirect signals. The question is not whether Oura matches PSG perfectly — no consumer device can — but whether the agreement is good enough for the intended use case.
Epoch-by-Epoch Accuracy: Data from the Brigham & Women's Hospital Study
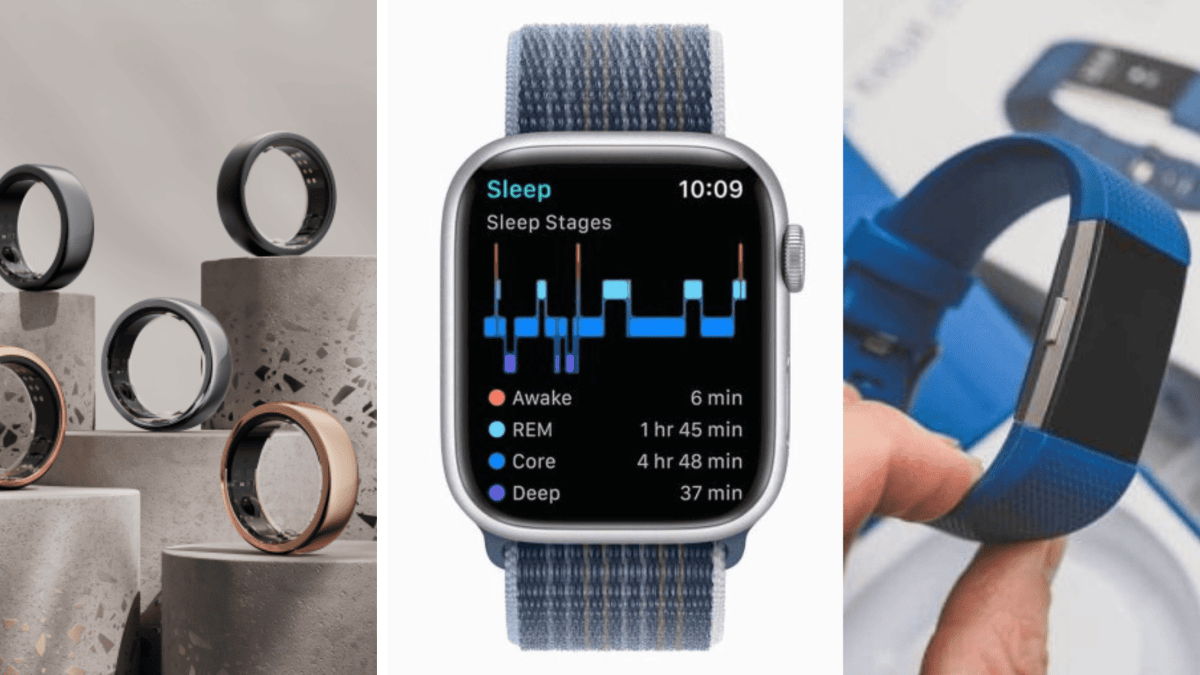
The most comprehensive head-to-head comparison of consumer sleep trackers against PSG was published in October 2024 in Sensors by researchers at Brigham & Women's Hospital (Robbins et al., 2024). The study enrolled 35 healthy adults aged 20–50 and simultaneously recorded a single night of sleep using PSG, the Oura Ring Gen 3, the Fitbit Sense 2, and the Apple Watch Series 8.
For sleep versus wake detection, all three devices performed well, with sensitivity at or above 95%. But four-stage classification (wake, light, deep, REM) revealed meaningful differences.
| Metric | Oura Ring Gen 3 | Apple Watch Series 8 | Fitbit Sense 2 |
|---|---|---|---|
| Sleep/wake sensitivity | ≥95% | ≥95% | ≥95% |
| Light sleep sensitivity | 78.2% | 86.1% | 78.0% |
| Deep sleep sensitivity | 79.5% | 50.5% | 61.7% |
| REM sensitivity | 76.0% | 82.6% | 67.3% |
| Wake detection sensitivity | 68.6% | 52.4% | 67.7% |
| Cohen's kappa (four-stage) | 0.65 | 0.60 | 0.55 |
Oura's deep sleep sensitivity of 79.5% was substantially higher than Fitbit's 61.7% and Apple's 50.5%. Its wake detection sensitivity of 68.6% also led the group. Critically, the study found that Oura did not significantly differ from PSG for total sleep time, wake after sleep onset (WASO), light sleep, deep sleep, or REM sleep at the group level. The only statistically significant bias was a 5-minute overestimation of sleep latency (p < 0.001).
The Cohen's kappa statistic — which measures agreement beyond chance — was 0.65 for Oura, compared to 0.60 for Apple Watch and 0.55 for Fitbit. In the context of sleep staging, a kappa of 0.65 is considered "substantial" agreement, though it is far from perfect. The study also noted practical reliability differences: Oura recorded usable data for all 35 participants, while Fitbit failed for 2 participants and Apple Watch failed for 6.
Epoch-by-Epoch Accuracy: Data from the University of Tokyo Study
A second large-scale validation study, published in March 2024 in Sleep Medicine by Svensson et al. at the University of Tokyo, provides additional evidence. This study is notable for its size: 96 healthy Japanese adults aged 20–70, contributing 421,045 30-second epochs of data across multiple nights of ambulatory PSG.
| Metric | Oura Ring Gen 3 (OSSA 2.0) |
|---|---|
| Sleep/wake sensitivity | 94.4–94.5% |
| Sleep/wake specificity | 73.0–74.6% |
| Overall sleep/wake accuracy | 91.7–91.8% |
| PABAK (adjusted kappa) | 0.83–0.84 |
| Sleep staging accuracy (light) | 75.5% |
| Sleep staging accuracy (REM) | 90.6% |
| Inter-device reliability | 94.8% |
The study found that Oura Ring Gen 3 running the OSSA 2.0 algorithm "did not significantly differ" from PSG for time in bed, total sleep time, sleep onset latency, sleep period time, WASO, light sleep, or deep sleep. The only statistically significant biases were a 1.1–1.5% underestimation of sleep efficiency and a 4.1–5.6 minute underestimation of REM sleep — small enough that most users would not notice them in daily use.
The inter-device reliability finding of 94.8% is particularly relevant for users who upgrade or replace their ring: it suggests that two Oura Rings worn simultaneously will produce very similar sleep-stage classifications, which is important for longitudinal trend tracking.
Head-to-Head Comparison: Oura Ring vs. Apple Watch vs. Fitbit
The Brigham & Women's Hospital study is uniquely valuable because it tested all three devices simultaneously against the same PSG recording. This eliminates the confounding variables that arise when comparing results across separate studies with different populations, protocols, and scoring methods.
The most striking finding was the magnitude of misestimation by the two wrist-worn devices:
| Bias vs. PSG | Oura Ring Gen 3 | Apple Watch Series 8 | Fitbit Sense 2 |
|---|---|---|---|
| Light sleep | Not significant | Overestimated by 45 min (p<0.001) | Overestimated by 18 min (p<0.001) |
| Deep sleep | Not significant | Underestimated by 43 min (p<0.001) | Underestimated by 15 min (p<0.001) |
| Wake | Not significant | Underestimated by 7 min (p<0.01) | Not significant |
| Sleep latency | Overestimated by 5 min (p<0.001) | Not reported | Not reported |
Apple Watch's 45-minute overestimation of light sleep and 43-minute underestimation of deep sleep are clinically meaningful errors. A user relying on Apple Watch data to track deep sleep trends would see a systematically distorted picture. Fitbit's errors were smaller but still significant: 18 minutes of overestimated light sleep and 15 minutes of underestimated deep sleep.
Oura's advantage likely stems from two factors. First, the ring form factor places the PPG sensor on the finger, where the vascular bed is dense and perfusion is high, producing a cleaner photoplethysmography signal than the wrist. Second, Oura's OSSA 2.0 algorithm has been refined through multiple iterations, each trained on PSG data. For detailed validation data on the other devices, see our Apple Watch sleep tracking review and Fitbit sleep tracking review.
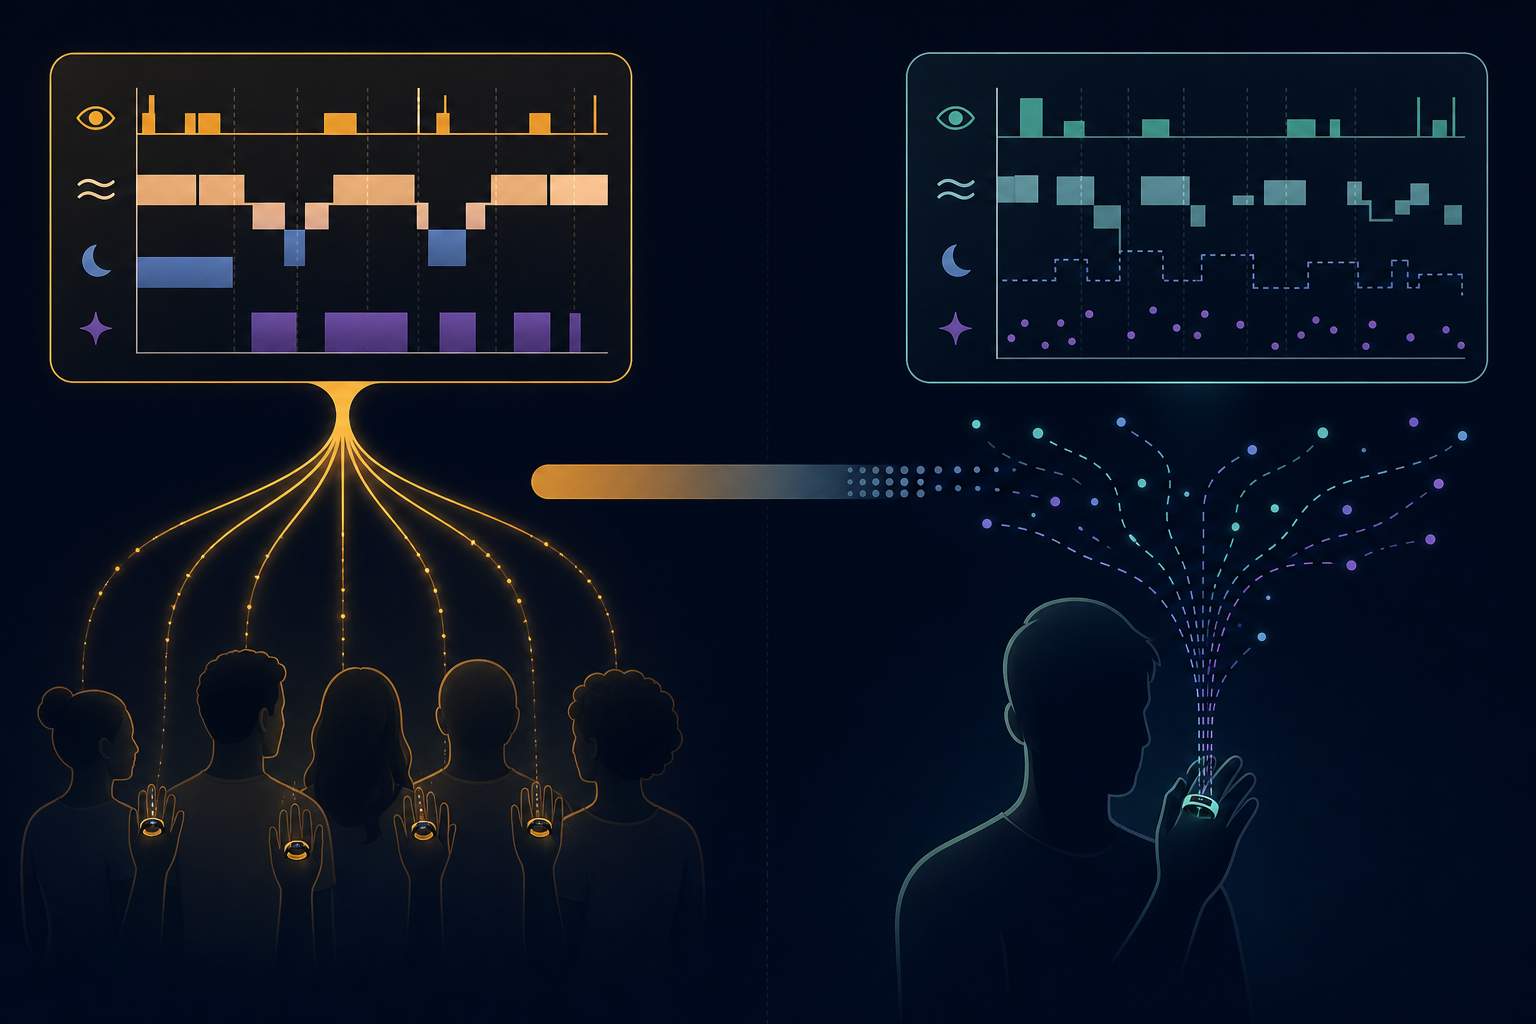
The Critical Gap: Group-Level Accuracy vs. Individual-Level Concordance
Here is where the story becomes more nuanced — and where many accuracy articles stop too early. The Brigham & Women's Hospital study reported that Oura's group-level estimates did not significantly differ from PSG for any sleep stage. That is an important finding, but it describes the average across 35 people. It does not tell you how well Oura performs for one person on one night.
To assess individual-level agreement, researchers use the intraclass correlation coefficient (ICC). An ICC of 1.0 means perfect agreement; an ICC of 0 means no agreement. For Oura, the ICCs for deep sleep and REM sleep were poor:
| Sleep Stage | ICC (95% CI) | Interpretation |
|---|---|---|
| Deep sleep | 0.32 (−0.01 to 0.59) | Poor individual-level concordance |
| REM sleep | 0.27 (−0.06 to 0.55) | Poor individual-level concordance |
| Light sleep | Not reported as poor | Moderate-to-good |
| Total sleep time | Not reported as poor | Good |
What does this mean in practice? If you take 100 people and average their Oura deep sleep readings, the average will be close to the PSG average. But if you look at your own Oura deep sleep number on Tuesday night, there is a substantial chance it differs from what PSG would have recorded by more than you might expect. The confidence intervals for both ICCs cross zero, meaning the true agreement could be anywhere from negligible to moderate.
This gap between group-level and individual-level accuracy is not unique to Oura. It is a fundamental limitation of inferring brain states from peripheral physiological signals. No consumer wearable can match the epoch-by-epoch precision of EEG-based sleep staging for an individual. The question is whether the device's accuracy is sufficient for its intended use — trend tracking over weeks and months — and the evidence suggests it is, provided users understand the limitations.
Known Failure Modes and Limitations
Beyond the group-level versus individual-level distinction, several specific failure modes affect Oura's real-world accuracy:
- Quiet rest scored as sleep: When you lie still in bed while awake — reading, watching television, or simply resting — Oura may classify this as light sleep. This is a common limitation of actigraphy-based sleep detection and is not unique to Oura.
- Sleep latency overestimation: The BWH study found Oura overestimates sleep onset latency by approximately 5 minutes on average. This means your reported "time to fall asleep" may be slightly longer than the true value.
- Single-night PSG study limitations: Both validation studies analyzed scheduled sleep episodes in a controlled environment. Real-world accuracy may be lower because wearables encounter daytime naps, fragmented sleep, and periods of quiet wakefulness that are excluded from PSG study protocols.
- Oura Ring 5 lacks independent validation: Oura Ring 5 was announced on May 28, 2026 and launched on June 4, 2026. As of this writing, no independent peer-reviewed PSG validation studies have been published for Ring 5. Oura claims improved accuracy through 12 signal pathways and stronger LEDs, but these are manufacturer claims, not independently verified data.
What the Accuracy Numbers Mean for Real-World Use
Given the evidence, here is a practical framework for interpreting Oura Ring sleep data:
- Trust sleep-wake detection: With >94% sensitivity for sleep vs. wake, Oura is excellent for tracking when you go to bed, when you wake up, and how much total sleep you get. This is the most clinically useful metric for most people.
- Use sleep stages for trends, not single nights: Your 7-day or 30-day average deep sleep percentage is more reliable than any single night's value. If you see a gradual decline in deep sleep over several weeks, that is worth paying attention to. A single night of 30 minutes of deep sleep is not necessarily meaningful.
- Do not compare your numbers to someone else's: Because individual-level concordance is poor, your Oura deep sleep reading may differ from your friend's Oura deep sleep reading even if your actual brain activity is identical. The device is calibrated for within-person trend tracking, not between-person comparison.
- Understand the sleep score: Oura's composite sleep score combines multiple metrics (duration, efficiency, timing, restorative sleep). It is more robust than any single stage estimate. For a deeper explanation of how this score is calculated, see our sleep score explainer.
Bottom Line: Is the Oura Ring Accurate Enough for Your Needs?
The evidence supports a clear conclusion: the Oura Ring is the most validated consumer sleep tracker available, with peer-reviewed data showing strong group-level accuracy and the best deep sleep detection among the major wearables. It is the only device in the BWH study that did not significantly misestimate any sleep stage, and its Cohen's kappa of 0.65 outperformed both the Apple Watch (0.60) and Fitbit (0.55).
However, the data also supports a critical caveat: individual-level concordance for deep and REM sleep is poor (ICCs 0.27–0.32), meaning single-night stage estimates should not be treated as clinical-grade measurements. The device is excellent for tracking sleep-wake patterns and long-term trends, but users who fixate on nightly deep sleep percentages are likely misinterpreting the data.
If you are in the evidence-verification stage deciding whether to purchase, the data supports Oura as the most accurate consumer option for sleep tracking — provided you go in with realistic expectations about what the numbers mean. If you already own an Oura Ring, the best practice is to focus on trends over weeks and months, use the sleep score as a composite indicator, and avoid over-interpreting any single night's stage breakdown.
For further reading, see our full Oura Ring product review for features and subscription value, and our sleep score explainer for a deeper understanding of how Oura calculates its composite metrics.
Supports these guides
Spot an error or have clinical feedback?
Because this article covers clinical, medication, or safety information, we use a moderated correction channel instead of open public comments. Let us know if something about “How Accurate Is the Oura Ring for Sleep Tracking? A Data-Driven Analysis of PSG Validation Studies” needs a closer look.
Send feedback on this article