Mechanism explainer
Sleep Score Explained: What the Number Actually Means and How Trackers Calculate It
Your morning sleep score is a proprietary composite index assembled differently by every platform — not a clinical measurement — and understanding how Oura, Fitbit, Garmin, Apple Watch, and WHOOP each construct it is the key to reading your score correctly, comparing across devices, and avoiding the trap of treating a single night's number as a verdict on your health.
What a Sleep Score Actually Is
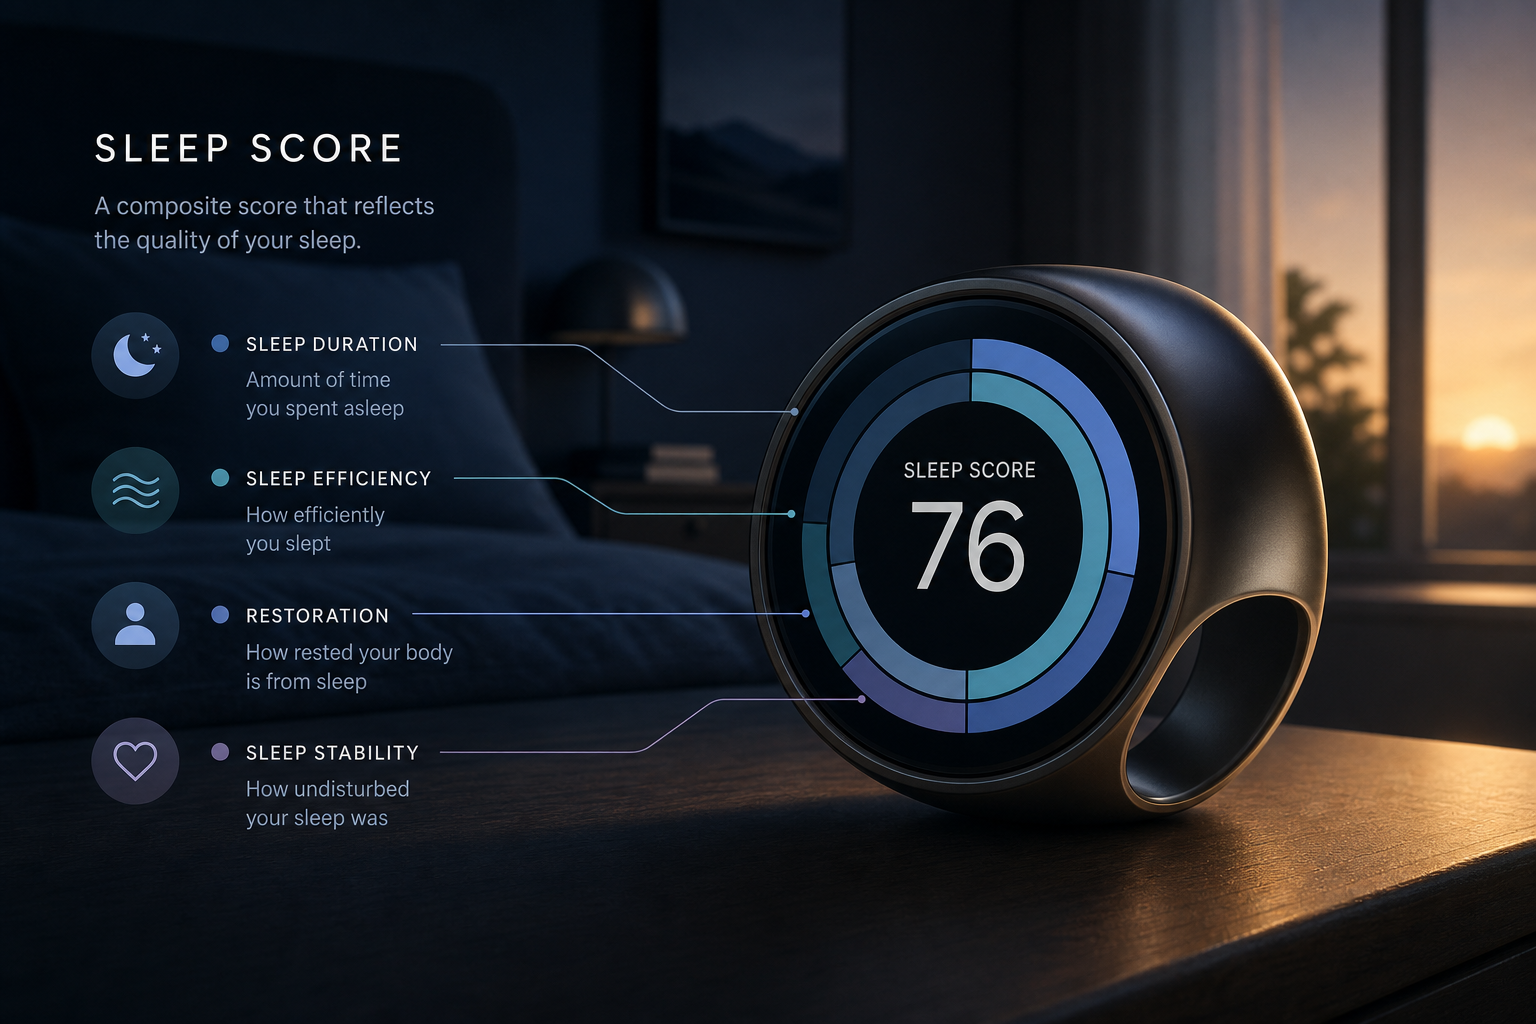
Every morning, millions of people check a number and let it shape how they feel about the night they just had. That number — a sleep score — looks authoritative. It sits between 0 and 100. It has a label like "Good" or "Fair." It implies precision.
But a sleep score is not a clinical measurement. It is not regulated by the FDA. It has no universal definition. It is a proprietary composite index that each company assembles according to its own weighting logic, using its own training data, and labels with its own tier names. As one recent analysis put it, the score itself is "a made up number" — a tool that functions less like a medical test and more like a behavioral feedback signal designed to keep you engaged with the platform.
That framing is not cynical — it is clarifying. Understanding what a sleep score actually is, and is not, is the prerequisite for reading it correctly. A score of 75 means something different on Oura than it does on Garmin or Apple Watch. The same underlying night of sleep can generate wildly different numbers depending on which device is on your wrist or finger, because each platform is answering a slightly different question with a different formula.
This matters practically. If you switch devices, your score will likely change — not because your sleep changed, but because you changed the formula. If you compare your score with a friend who uses a different platform, you are comparing apples to oranges. And if you treat a single night's number as a verdict on your health, you are misusing the tool in a way that can backfire.
The Sensors Underneath Every Score
Before examining how any specific platform builds its score, it helps to understand what consumer wearables can and cannot measure. Every sleep score starts with biosignals captured by hardware sensors. Those signals are then processed by algorithms to infer sleep states. The gap between what the sensor measures and what the algorithm claims to know is where most of the uncertainty lives.
The four main sensor types found in consumer sleep trackers:
- Photoplethysmography (PPG): An optical sensor that shines light into the skin and measures how blood volume changes with each heartbeat. From this signal, devices derive heart rate, heart rate variability (HRV), and — in some devices — blood oxygen saturation (SpO2). PPG is the workhorse of most modern wearable sleep trackers.
- Accelerometer: Detects physical movement. Devices use movement data to distinguish sleep from wakefulness and, in combination with other signals, to infer lighter versus deeper sleep stages. Accelerometer-only devices perform well for basic sleep/wake detection but fall short at classifying multiple sleep stages accurately.
- Skin temperature: Tracks peripheral body temperature across the night. Temperature naturally drops during NREM sleep and rises toward morning, making it a useful circadian signal. Devices like the Oura Ring incorporate skin temperature to improve both sleep stage classification and circadian timing estimates.
- SpO2 (blood oxygen): Estimates blood oxygen saturation, which can flag potential breathing disruptions during sleep. SpO2 monitoring is present in many current-generation devices but is not a primary input for most sleep scores — it is more relevant as a screening signal for conditions like sleep apnea.
None of these sensors measure brainwave activity. The gold standard for sleep staging — polysomnography (PSG) — uses EEG electrodes to directly observe the electrical patterns that define N1, N2, N3, and REM sleep. Consumer wearables infer those same stages from indirect biosignals. This is a fundamental limitation, not a flaw in any particular device.
Combining sensor types matters significantly. A scoping review of 35 studies covering 62 wearable setups found that devices using only accelerometer data perform well for sleep/wake detection but fall short at multi-stage classification. Adding HRV features to accelerometer data approximately doubled the Cohen's kappa value for four-stage classification in one cited study. Average four-stage classification accuracy across devices reviewed was 65.2% — a meaningful figure to keep in mind when reading any stage-specific breakdown in your app.
How Each Major Platform Builds Its Score
With the sensor foundations in place, the differences between platforms become much more legible. Each company has made distinct choices about which inputs to include, how heavily to weight them, and what tier labels to apply. Those choices reflect both scientific priorities and product design decisions.
Oura: Seven Contributors Including Circadian Timing
Oura's Sleep Score runs from 0 to 100 and is built from seven named contributors: Total Sleep, Efficiency, Restfulness, REM Sleep, Deep Sleep, Latency, and Timing. Most of these are intuitive, but Timing is distinctive — it measures whether your sleep aligns with your circadian rhythm, with the optimal window defined as having the midpoint of your sleep fall between midnight and 3 a.m. This circadian alignment component reflects how light exposure and circadian timing interact with sleep quality — a dimension most other platforms ignore entirely.
Oura considers a sleep efficiency of 85% or higher optimal for adults. Scores of 100 are deliberately rare — the system is calibrated so that even excellent sleep typically lands in the 85–100 Optimal tier rather than at the ceiling. The three tiers are: Optimal (85–100), Good (70–84), and Pay Attention (below 70).
Fitbit / Google Health: Six Metrics, Age- and Gender-Personalized
The current Google Health sleep score — which powers Fitbit devices — uses six metrics: Sleep Duration, Time to Sound Sleep (the settling phase from first sleep attempt to sustained sleep), Sound Sleep (total undisturbed sleep across all stages), Restlessness (brief sub-five-minute stirrings), Full Awakenings (distinct interruptions over five minutes), and Interruptions (total time in longer wakefulness bouts).
A notable feature is that the algorithm compares your data against targets tailored to your age and gender — meaning two people with identical raw sleep data can receive different scores if they are in different demographic groups. Most users score between 72 and 83. The four tiers are: Excellent (90–100), Good (80–89), Fair (60–79), and Poor (below 60). Detailed restoration breakdowns are available only through Fitbit Premium.
Garmin: Firstbeat Analytics With HRV Weighting
Garmin's sleep score is powered by Firstbeat Analytics, a third-party physiological analytics engine. Inputs include heart rate, HRV, body movement, time in sleep stages, and an average stress score derived from HRV data. The score is described as reflecting both sleep duration and sleep quality, with particular weight given to "evidence of recovery activity occurring in your autonomic nervous system" — meaning the HRV-derived stress signal plays a meaningful role.
Garmin does not publicly disclose the exact numerical weighting of each input. The four tiers are: Excellent (90–100), Good (80–89), Fair (60–79), and Poor (below 60). In 2024, the average sleep score for Garmin users was a Fair 71, with only 5% of users averaging in the Excellent range — suggesting Garmin's calibration is noticeably stricter than some competing platforms.
Apple Watch: Habit-Weighted, Launched September 2025
Apple Watch's sleep score, introduced in September 2025, takes a structurally different approach from the other platforms. Rather than weighting sleep stages or physiological recovery signals, Apple's formula is explicitly habit-focused: Sleep Duration contributes 50 points, Bedtime Consistency (measured against the past 13 nights) contributes 30 points, and Sleep Interruptions contribute 20 points.
The five tiers as of watchOS 26.2 are: Very High (96–100), High (81–95), OK (61–80), Low (41–60), and Very Low (0–40). Because duration and consistency together account for 80% of the score, a person who sleeps a consistent eight hours but has fragmented, low-quality sleep can still receive a high score. This makes Apple's score structurally generous compared to platforms that weight physiological recovery signals.
WHOOP: A Dual-Metric System, Not a Unitary Score
WHOOP is structurally different from the other four platforms and should not be directly compared to them on a 0–100 scale. Instead of a single sleep score, WHOOP uses two separate metrics: Sleep Performance % and Recovery %.
Sleep Performance % measures how much sleep you got relative to how much WHOOP calculated you needed — incorporating sleep sufficiency, consistency, efficiency, and sleep stress. Recovery % is a readiness signal (color-coded Green, Yellow, or Red) built primarily from HRV, resting heart rate, respiratory rate, and sleep performance. Critically, both metrics are compared against your personal baseline rather than a population standard. A 75% Sleep Performance on WHOOP does not mean the same thing as a 75 on any other platform.
For a detailed look at how WHOOP's accuracy compares to Oura in PSG validation studies, the Oura Ring vs. WHOOP PSG validation comparison covers the head-to-head evidence in depth. For a full breakdown of WHOOP's metrics and methodology, see the WHOOP Band sleep tracking review.
The Same Score, Different Meaning: A Cross-Platform Comparison
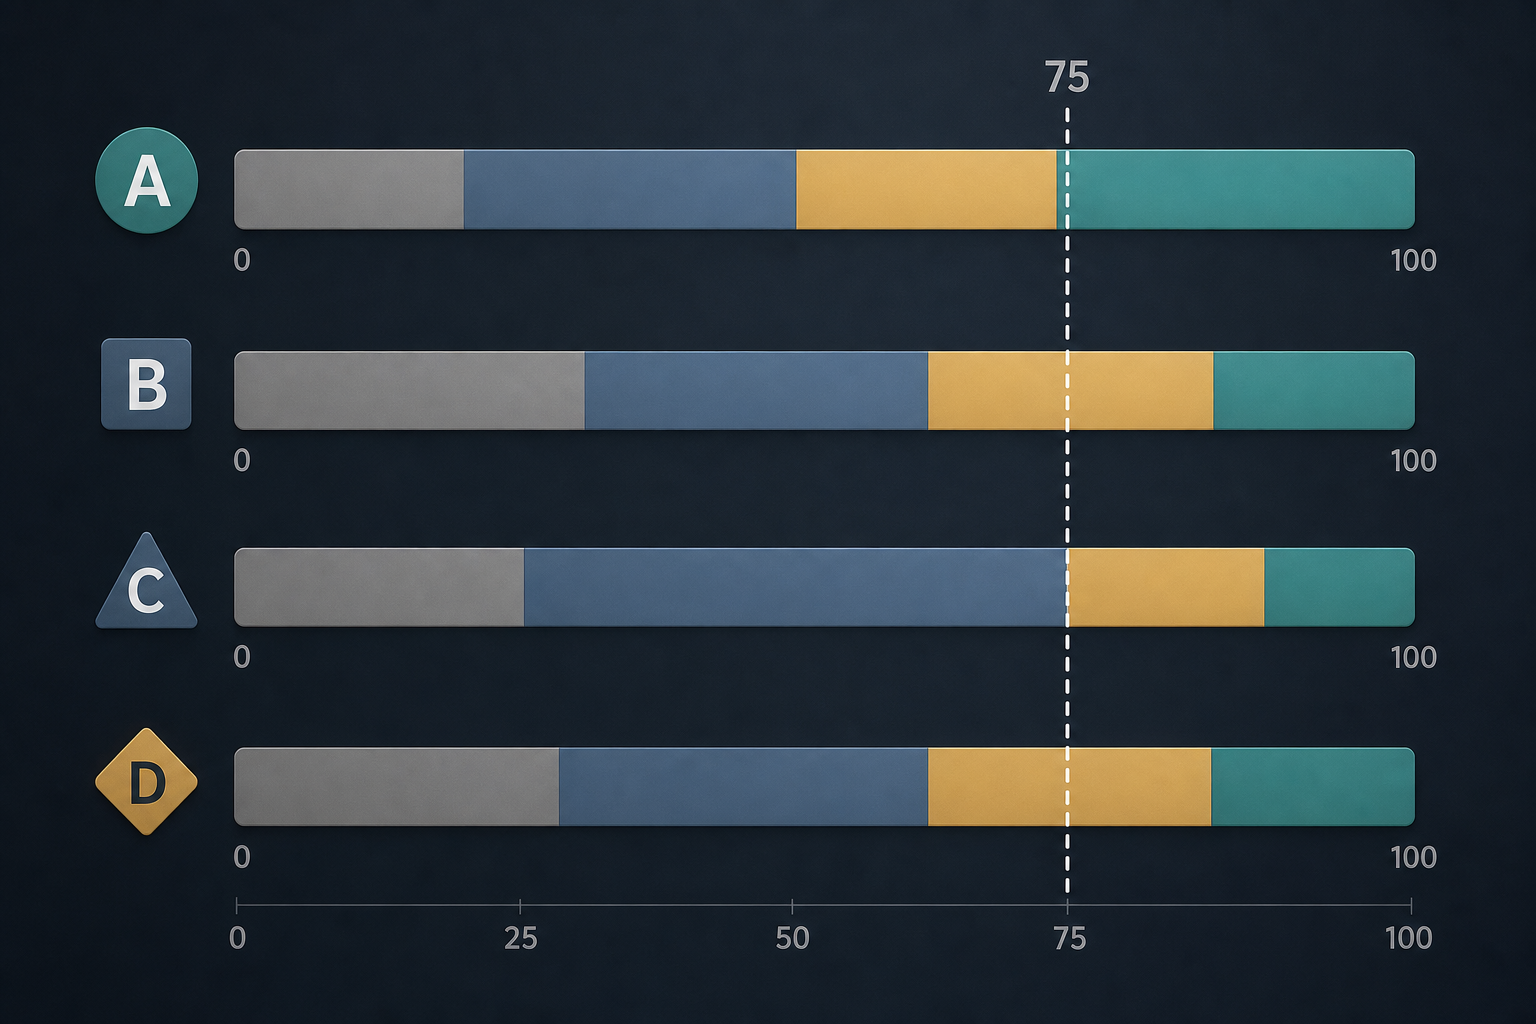
The most concrete way to see why cross-platform score comparison is misleading is to look at what the same number means on different platforms. A score of 75 is not a universal quality signal — it occupies a different tier on every platform that uses a unitary 0–100 scale.
| Platform | Score of 75 Falls In | Tier Name | Full Tier Range |
|---|---|---|---|
| Oura | Good | Good | 70–84 |
| Fitbit / Google Health | Fair | Fair | 60–79 |
| Garmin | Fair | Fair | 60–79 |
| Apple Watch | OK (upper portion) | OK | 61–80 |
On Oura, 75 is solidly Good. On Garmin and Fitbit, 75 sits in the Fair tier — the same range that Garmin users averaged in 2024. On Apple Watch, 75 lands in the upper portion of the OK tier, just below the High threshold. These are not subtle differences — they reflect genuinely different calibration philosophies and different definitions of what constitutes adequate sleep.
Apple Watch's scoring has been described as notably generous relative to Oura and Garmin at equivalent sleep quality — a consequence of its habit-focused weighting that gives 80% of the score to duration and consistency rather than to physiological recovery signals. A person who consistently gets seven hours of sleep at the same time each night will score well on Apple Watch even if the sleep itself is fragmented or physiologically unrestorative.
How Accurate Are Sleep Scores? What PSG Validation Studies Show
Two peer-reviewed PSG validation studies from 2023 and 2024 provide the most directly applicable accuracy evidence for the devices most people are using. Their findings are worth reading carefully — and the discrepancy between them is worth understanding, because it tells you something important about when wearables work and when they do not.
A 2023 multicenter study tested 11 consumer sleep trackers against in-lab PSG across 75 participants at two Korean institutions. For four-stage sleep classification, epoch-by-epoch Cohen's kappa — the standard measure of agreement beyond chance — ranged from 0.30 (Apple Watch Series 8) to 0.42 (Galaxy Watch 5, Fitbit Sense 2). Oura Ring 3 scored 0.35. In standard interpretation, kappa values of 0.21–0.40 represent fair agreement, and 0.41–0.60 represents moderate agreement. None of the devices in this study reached substantial agreement with PSG.
A 2024 study from Brigham and Women's Hospital and Harvard Medical School tested the same three devices — Oura Ring Gen3, Fitbit Sense 2, and Apple Watch Series 8 — against PSG in 35 healthy adults. The results were considerably more favorable: Oura reached a kappa of 0.65 (substantial agreement), Fitbit 0.55 (moderate), and Apple Watch 0.60 (moderate). Oura was not significantly different from PSG on seven of eight nightly summary measures. Apple Watch significantly underestimated deep sleep by 43 minutes and overestimated light sleep by 45 minutes compared to PSG. Fitbit overestimated light sleep by 18 minutes and underestimated deep sleep by 15 minutes.
| Device | Study | Population | 4-Stage Kappa | Notable Bias |
|---|---|---|---|---|
| Oura Ring Gen3 | PMC10654909 (2023) | Mixed, includes sleep disorders | 0.35 (fair) | Negligible proportional bias vs. other devices |
| Oura Ring Gen3 | PMC11511193 (2024) | Healthy adults | 0.65 (substantial) | Not significantly different from PSG on 7 of 8 measures |
| Apple Watch Series 8 | PMC10654909 (2023) | Mixed, includes sleep disorders | 0.30 (fair) | Overestimates sleep; misclassifies quiet wake |
| Apple Watch Series 8 | PMC11511193 (2024) | Healthy adults | 0.60 (moderate) | Underestimated deep sleep by 43 min; overestimated light sleep by 45 min |
| Fitbit Sense 2 | PMC10654909 (2023) | Mixed, includes sleep disorders | 0.42 (moderate) | Overestimates sleep; misclassifies quiet wake |
| Fitbit Sense 2 | PMC11511193 (2024) | Healthy adults | 0.55 (moderate) | Overestimated light sleep by 18 min; underestimated deep sleep by 15 min |
A systematic review comparing Fitbit Charge 4, Garmin Vivosmart 4, and WHOOP to PSG found that all three devices showed high sensitivity for detecting sleep (91–98%) but much lower specificity for detecting wakefulness (30–61%). WHOOP showed the least disagreement for total sleep time and light and deep sleep, but the largest overestimation of REM sleep (+21 minutes). Garmin showed the largest total sleep time overestimation (+46.9 minutes) and the lowest sensitivity for detecting deep sleep (45%) and REM sleep (34%).
Across all studies and all devices, one pattern holds: wearables are reliable at detecting that you are asleep but substantially less reliable at correctly classifying which stage of sleep you are in — and particularly poor at detecting when you are quietly awake.
Why Scores Are Least Reliable When You Need Them Most
There is a troubling irony in how wearable sleep tracking performs. The people most motivated to use a sleep tracker — people who sleep poorly, who lie awake for long stretches, who suspect they have insomnia or a sleep disorder — are precisely the people for whom the scores are least accurate.
The core problem is that most wearables systematically overestimate sleep by misclassifying quiet wakefulness as light sleep. When you lie still in bed, not moving, your accelerometer looks identical to someone who is asleep in light NREM sleep. Without a strong physiological signal — like the HRV pattern associated with sleep — the algorithm defaults to calling it sleep. The 2023 multicenter PSG study described this directly: insomniacs often lie still in bed while trying to sleep, and those periods of wakefulness can be misinterpreted as sleep.
The practical consequence is that a person with insomnia who spends two hours lying motionless in the dark before finally falling asleep may receive a sleep score that looks reasonable — because the tracker counted much of that wakefulness as light sleep. The score is flattering. The experience was not.
This connects directly to how sleep disorders disrupt the architecture that trackers depend on. Conditions like insomnia, sleep apnea, and chronic stress fragment the sleep patterns that algorithms use as reference points — making the inferences less reliable precisely when the underlying sleep is most disrupted.
The algorithm opacity problem compounds this. All major validation studies note that wearable companies generally do not share the methodology they use to score sleep data, nor do they publish the kind of rigorous research sleep experts would need to evaluate the algorithms. When the training data and weighting logic are proprietary, there is no way to know whether a given algorithm was validated on populations similar to yours — or whether it handles the specific patterns associated with your sleep problem well at all.
One additional caveat worth noting: all published validation studies used older hardware generations — Oura Ring Gen3, Apple Watch Series 8, Fitbit Sense 2. Current-generation devices may perform differently, but no independent PSG validation data for 2025–2026 hardware is available at the time of writing.
How to Use Your Sleep Score Without It Worsening Your Sleep
Given everything above — proprietary formulas, moderate accuracy at best, systematic biases that favor flattering scores for light sleepers and penalize people with genuine sleep problems — how should you actually use a sleep score?
The answer is: as a multi-week trend signal, not a nightly verdict. A single night's score is affected by too many variables — alcohol, stress, illness, an unusual schedule, a hot room — to be interpreted as a meaningful data point in isolation. Looked at over two to four weeks, patterns become visible: does your score drop consistently after late nights? Does it improve when you maintain a regular bedtime? Does it correlate with how rested you actually feel? That trend-level reading is where the tool has genuine value.
- Use a rolling average, not last night's number. Most platforms display weekly or monthly trend views. That view is more meaningful than any single morning score.
- Treat your subjective energy as a co-equal signal. If your score is 82 but you feel exhausted, trust the exhaustion. Google Health's own guidance notes: "Always trust your body first. If you wake up feeling energised, don't let a lower score induce anxiety."
- Understand that scores of 100 are designed to be rare. Oura explicitly calibrates its system so that perfect scores are exceptional, not routine. Chasing a perfect score is chasing a target the platform was not designed to let you reach regularly.
- Note what changes your score, not just what your score is. Behavioral correlations — what you did the evening before a high or low score — are more actionable than the number itself.
There is a documented risk in over-engagement with sleep scores that is worth naming directly: orthosomnia. Defined in a 2023 peer-reviewed editorial as "the obsessive pursuit of optimal sleep metrics based on fitness tracker or mobile phone app data," orthosomnia describes a pattern where the tool meant to improve sleep begins to worsen it.
Orthosomnia-associated behaviors include extending bedtime specifically to inflate scores, attempting to eliminate any in-bed activity that might lower the score, checking the tracker compulsively during the night or immediately upon waking, and experiencing anxiety when separated from the device. A qualitative study cited in that editorial found that tracker users engaged in exactly these behaviors — not because they felt unwell, but because the number was not where they wanted it.
The mechanism by which this backfires is straightforward: these behaviors increase pre-sleep arousal and performance anxiety around sleep — the same cognitive patterns that drive and maintain insomnia. The tracker becomes a source of sleep-related anxiety rather than a tool for reducing it.
If a consistently low score accompanies persistent fatigue, daytime impairment, or behavioral changes around sleep — especially if you are already anxious about sleep — the appropriate response is not more tracking. Professional evaluation and, for most people, cognitive behavioral therapy for insomnia (CBT-I) is the evidence-based next step. CBT-I addresses the cognitive and behavioral patterns that perpetuate insomnia — including the performance anxiety and hyperarousal that orthosomnia can generate — in ways that no tracking app can.
A sleep score is a useful signal when it is one input among several — alongside how you feel, how you function, and how your patterns change over time. It becomes a problem when it becomes the primary lens through which you evaluate your sleep. The number was never designed to carry that weight.
Supports these guides
Spot an error or have clinical feedback?
Because this article covers clinical, medication, or safety information, we use a moderated correction channel instead of open public comments. Let us know if something about “Sleep Score Explained: What the Number Actually Means and How Trackers Calculate It” needs a closer look.
Send feedback on this article