
The confusing part of a wearable sleep score is not that the number exists. The number is useful. It gives you something small and readable to look at with coffee instead of asking you to interpret heart rate, movement, breathing patterns, sleep stages, and bedtime regularity before breakfast. The problem starts when that tidy 0–100 score begins to feel like a lab result.
If your Oura Ring says 82 and your friend’s Apple Watch says 82, those two numbers do not mean the same thing. If you switch from Fitbit to Garmin and your score drops, that does not automatically mean your sleep got worse. A wearable sleep score is a brand-defined summary. Each company decides which signals count, how much they count, and what kind of night deserves a “good” or “excellent” label.
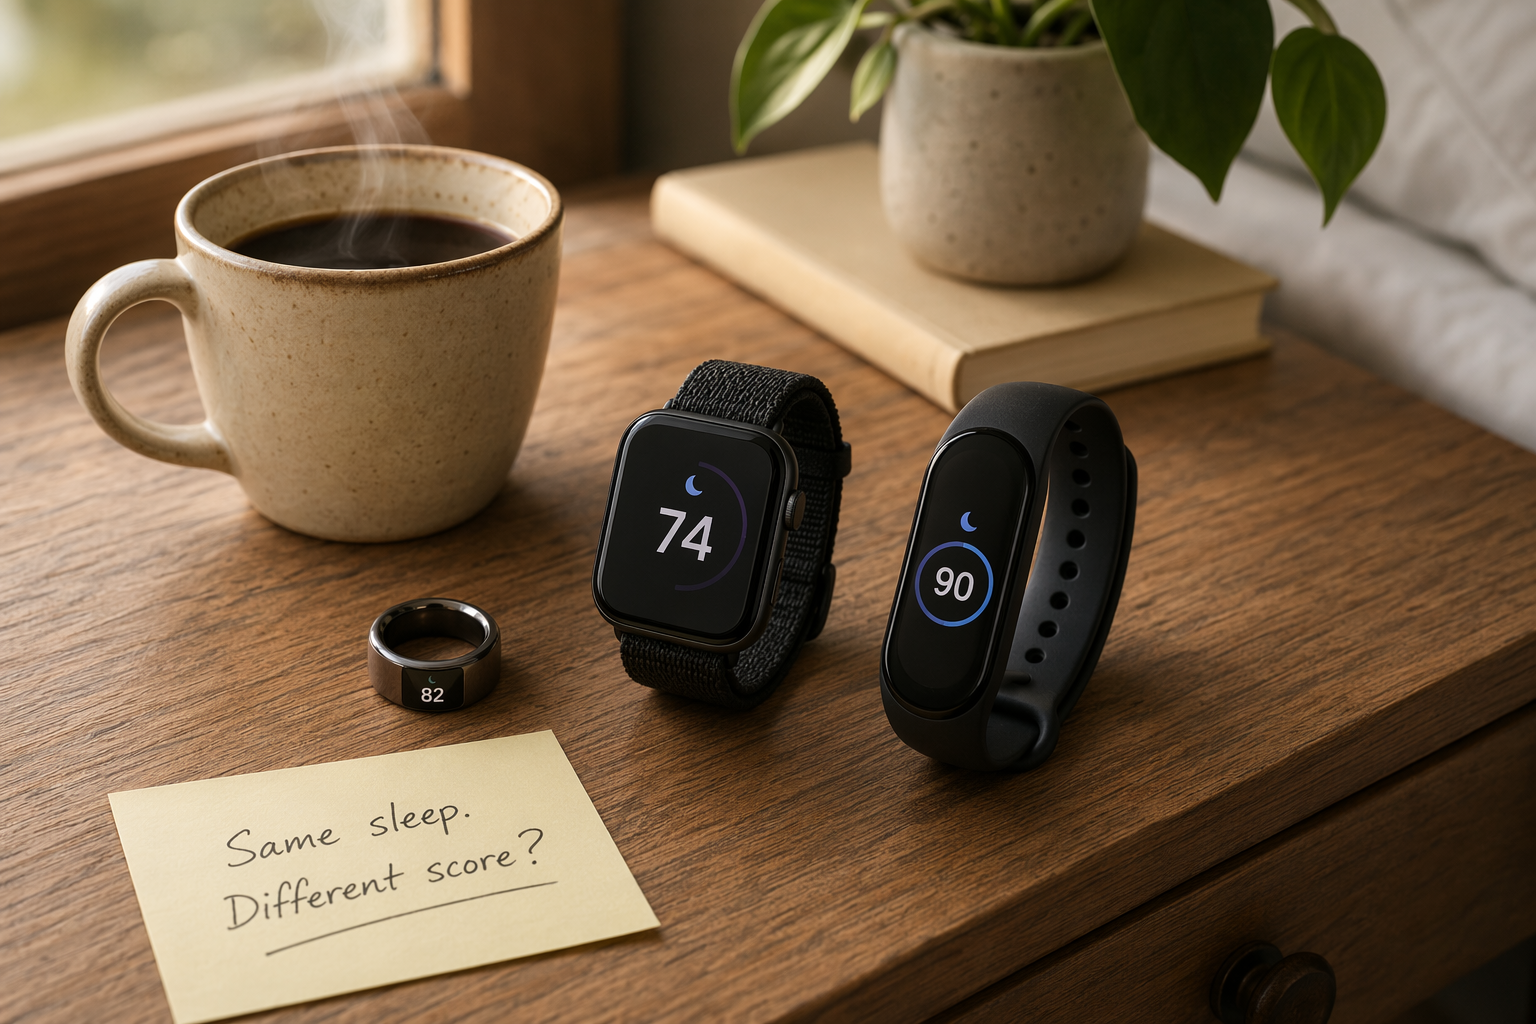
The Same 0–100 Scale Hides Different Formulas
Most major wearables present sleep as a score from 0 to 100, but the shared scale is more cosmetic than scientific. Oura, Apple, Garmin, and Fitbit/Google Health all compress a night into one number, yet they do not compress the same ingredients.
| Device ecosystem | What feeds the sleep score | What is especially visible in the formula | How to read the number |
|---|---|---|---|
| Oura | Seven weighted contributors: Total Sleep, Efficiency, Restfulness, REM Sleep, Deep Sleep, Sleep Latency, and Sleep Timing. | Oura gives the score a multi-part structure, including timing and latency as named contributors. | Scores run from 0–100; 85+ is labeled optimal, 70–84 good, and under 70 needs attention. [1] |
| Apple Watch | Three weighted components: Sleep Duration, Bedtime Consistency, and Sleep Interruptions. | Apple documents a 50/30/20 split: Sleep Duration contributes 50 points, Bedtime Consistency 30 points, and Sleep Interruptions 20 points. Consistency uses a 13-day rolling baseline. | Scores run from 0–100, but the number is strongly shaped by duration because duration is half of the total possible score. [2] |
| Garmin | Firstbeat Analytics combines sleep duration, sleep quality, and stress score. | Garmin folds physiological stress into the sleep score alongside duration and quality. | Scores run from 0–100. Garmin reports an average user score of 71, labeled fair, and says only 5% of users average excellent scores of 90–100. [3] |
| Fitbit / Google Health | Current-generation components include Duration, Time to Sound Sleep, Sound Sleep, Restlessness, and Full Awakenings. | Google Health distinguishes restlessness from full awakenings using a 5-minute threshold. | Typical average scores range from 72–83, but current-generation scores should not be treated as identical to legacy Fitbit scoring. [4] |
That table is the plainest explanation for why sleep scores do not travel cleanly across brands. The score is not measuring one universal object called “sleep quality.” It is translating selected signals through a manufacturer’s formula. The sensor data matter, but so do the design choices inside the scoring system.
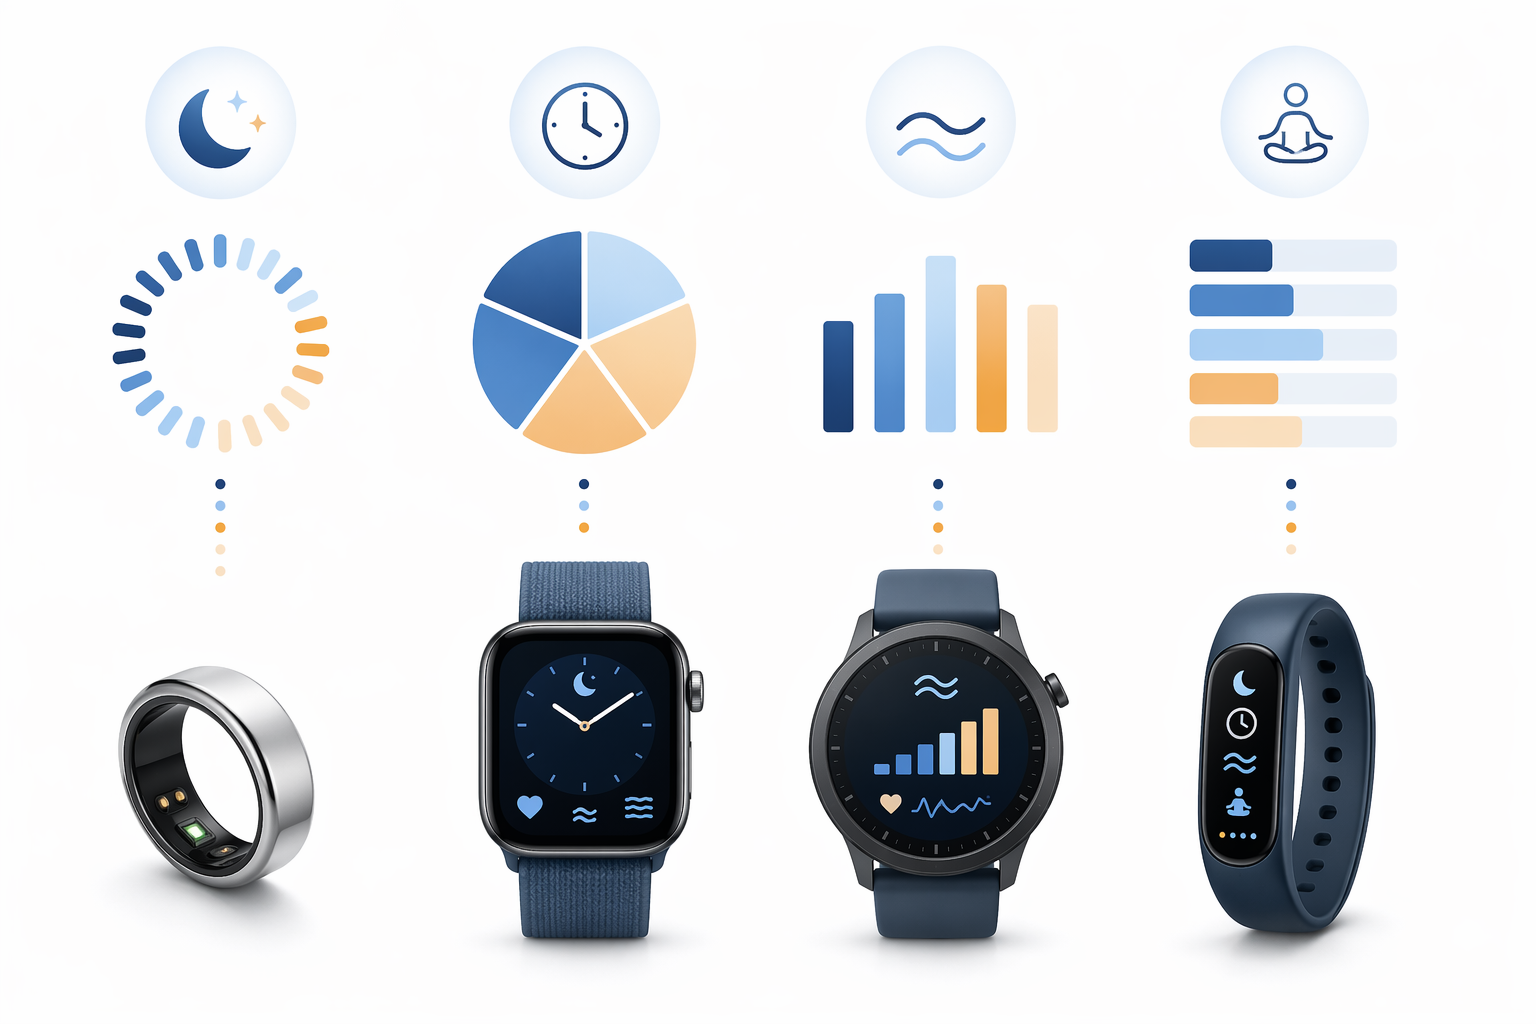
Why One Night Can Get Different Scores
Imagine a night that is short but neat: you go to bed at your usual time, fall asleep quickly, wake up only briefly, and get fewer hours than you wanted. Apple’s documented formula gives Sleep Duration 50 of the possible 100 points, so the short duration has a large path into the final score. Bedtime Consistency and Sleep Interruptions still matter, but they do not have equal weight with duration. [2]
Oura would not be solving the same equation. Its seven contributors include Total Sleep, Efficiency, Restfulness, REM Sleep, Deep Sleep, Sleep Latency, and Sleep Timing. A night can therefore be tugged up or down by whether sleep timing was aligned, whether latency was short or long, and how the device estimated stage-related contributors. [1]
Garmin has another route. Its sleep score is powered by Firstbeat Analytics and combines sleep duration, sleep quality, and stress score. That means a night that looks acceptable by clock time may still be penalized if the stress component is unfavorable. Garmin’s own user benchmark also shows how labels can shape perception: an average user score of 71 is “fair,” while an average “excellent” score of 90–100 is reported for only 5% of users. [3]
Fitbit and Google Health use a current-generation structure that separates Duration, Time to Sound Sleep, Sound Sleep, Restlessness, and Full Awakenings. The 5-minute threshold matters here: shorter disruptions can be handled as restlessness, while longer ones can count as full awakenings. That distinction can change how a fragmented night is summarized, even when the person remembers only that they “slept badly.” [4]
None of this proves that the most complicated formula is the most accurate. A formula with more named contributors can still depend on imperfect signals. A simpler formula can be easier to interpret. The useful distinction is not “good formula” versus “bad formula.” It is that each brand is answering a slightly different question.
The Labels Matter Almost as Much as the Number
A score rarely arrives alone. It arrives with a label, a color, an icon, or a little nudge. Oura labels 85 and above as optimal, 70–84 as good, and under 70 as needing attention. Garmin says the average user score is 71, which it labels fair, and that only 5% of users average excellent scores from 90–100. Fitbit/Google Health says typical average scores range from 72–83. [1][3][4]
Those labels are not trivial. A score of 72 may feel disappointing in one app and ordinary in another. A score in the low 80s may look like a mild warning if a device regularly shows you crown icons or “optimal” language at 85 and above. The emotional readout is part of the product experience, even when the underlying number is only a summary.
This is why comparing morning scores in a group chat can become misleading so quickly. The person with the higher number may not have slept better in any universal sense. Their device may reward their particular pattern more generously, use different thresholds, or compare them against a different internal benchmark.
Accuracy Is Not Just About Sleep Stages
When people ask whether a sleep score is accurate, they often mean, “Did the device correctly detect my sleep stages?” That is part of the question, but it is not the whole question. A sleep score can be shaped by duration, interruptions, timing, latency, restlessness, stress, and estimated time in REM or deep sleep. Even if two devices detected the same sleep and wake periods, they could still score the night differently because their formulas value different things.
That distinction keeps the claim narrower and more useful. Consumer wearables are not being judged here against polysomnography point by point. The practical issue is that a sleep score is one layer removed from the raw detection problem. First the device estimates what happened overnight. Then the company’s scoring system decides what that estimate should mean.
For readers who want to go deeper, the next layer is sleep-stage interpretation: what deep sleep and REM estimates can and cannot tell you, how Fitbit-specific validation evidence should be read, and how broader tracker accuracy studies compare device outputs with research-grade methods. Those are related questions, but they do not turn a brand-specific score into a universal unit.
Algorithm Changes Can Look Like Personal Changes
Fitbit and Google Health need one extra caution because the documented scoring components refer to the current-generation algorithm. Legacy scores differ. If a user moves from an older Fitbit scoring experience to the newer Google Health approach, a change in the morning number may reflect a scoring transition as well as any real change in sleep. [4]
The same general caution applies whenever a platform updates sleep tracking. A changed score after a software update is not automatically a changed body. It may be a changed definition of what the app rewards, penalizes, or labels.
Platform Averages Are Useful, but They Are Not Personal Verdicts
Benchmarks can be helpful because they show how a score is distributed inside a platform. Garmin’s note that an average score of 71 is fair and that only 5% of users average 90–100 makes the “excellent” label feel appropriately rare rather than personally insulting. Fitbit/Google Health’s typical average range of 72–83 gives a similar sense of where many users land. [3][4]
Cross-platform averages require more care. Terra’s real-world user data can compare sleep-score behavior across platforms, but those comparisons cannot prove that each platform’s user population is demographically or behaviorally identical. Differences can reflect algorithms, sensors, users, or some mix of all three. [5]
That is the quiet trap in brand-to-brand comparison. A population-level difference may be interesting, but it should not become a personal verdict that your device is harsher, your friend’s device is easier, or your body is performing worse.
How to Use the Score Without Giving It Too Much Authority
The best use of a wearable sleep score is usually within one device ecosystem over time. Your Oura score compared with your Oura history is more meaningful than your Oura score compared with someone else’s Apple Watch. Your Fitbit trend before and after a schedule change is more useful than a one-night comparison with a Garmin user.
- Watch the direction, not just the isolated number: a steady drop over several nights deserves more attention than one odd morning.
- Compare like with like: same device, same account, same scoring system, and preferably the same recent app generation.
- Look for agreement with real-life signals: daytime sleepiness, waking during the night, illness, alcohol, travel, stress, medication changes, or a shifted bedtime.
- Treat cross-brand comparisons as conversation, not evidence: an 82 from one brand is not the same measurement as an 82 from another.
- Be cautious after app or algorithm changes: a new scoring model can move the number without an equally dramatic change in your sleep.
A sleep score can still be worth checking. It can help you notice that late dinners, a new training block, a stressful week, or a consistent bedtime is moving your nights in a recognizable direction. It just should not be asked to do more than its design allows.
Use the number as a trend signal inside its own system. Let it start a question about your routine or symptoms. Do not use it as an absolute truth, and do not compare your 82 with someone else’s 82 unless both numbers came from the same scoring world.
References
- Your Oura Sleep Score & How To Interpret It, Oura
- View your sleep score on Apple Watch, Apple Support
- How Garmin watches track your sleep, calculate sleep score, Garmin
- Sleep score in the Fitbit app, Google Health Help
- Sleep Score Benchmarking, Terra
Comments
Join the discussion with an anonymous comment.