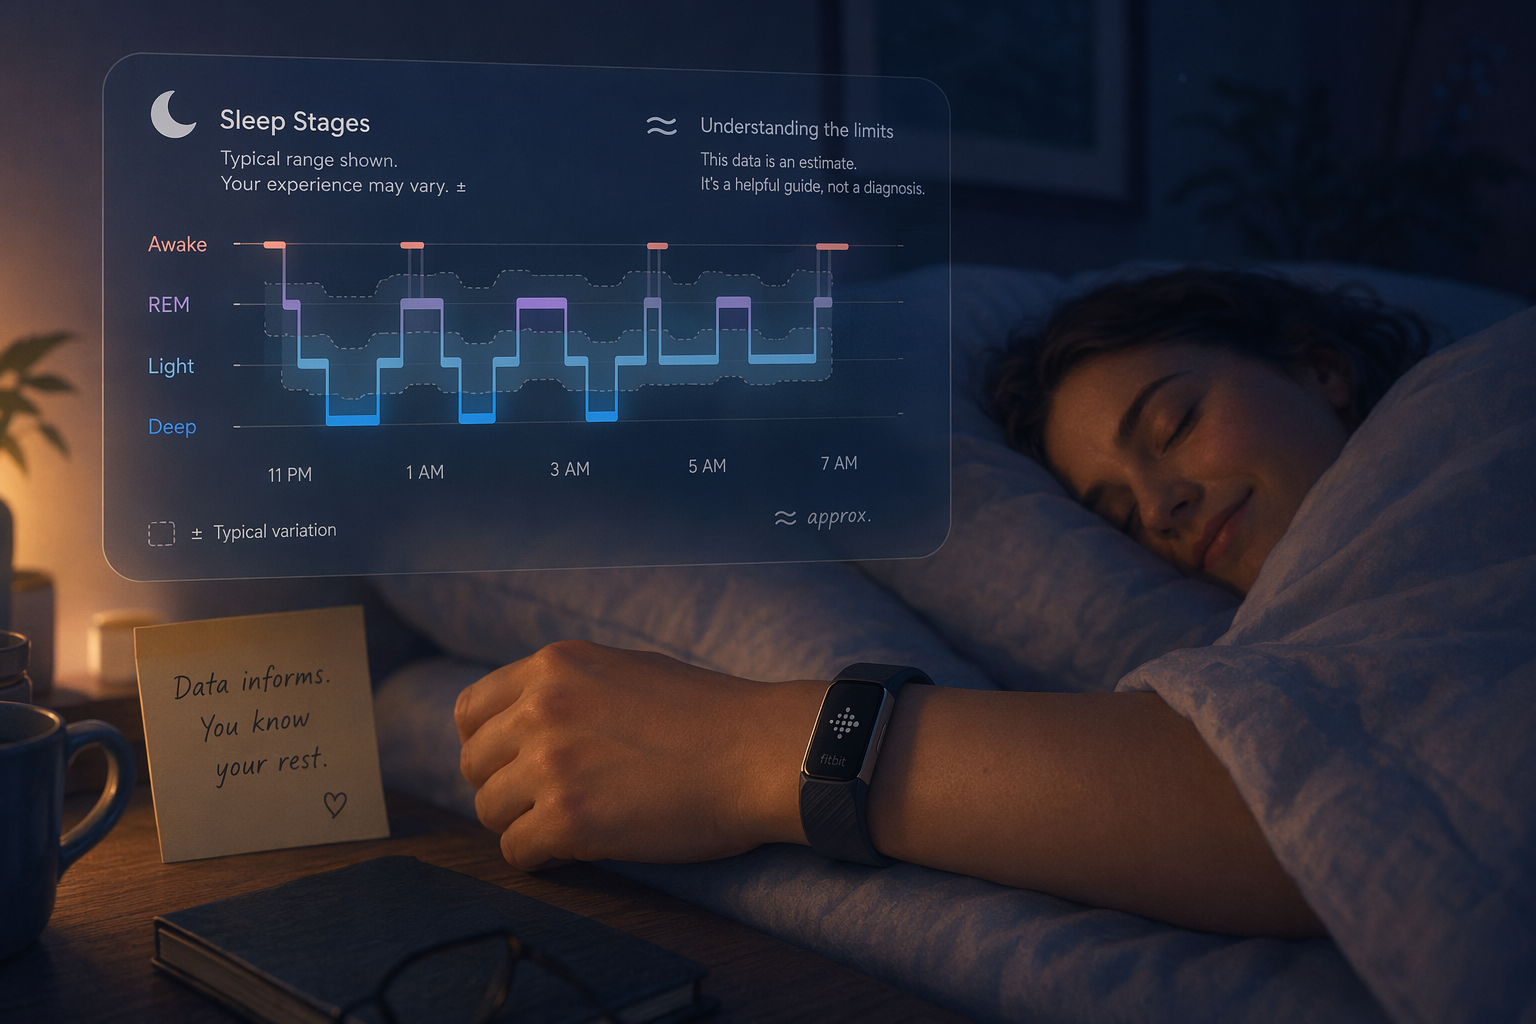

Every morning, if you wear a compatible Fitbit — Versa, Sense, Charge, Inspire, Luxe, or Pixel Watch — the app presents you with a single number between 0 and 100 called your sleep score. It is designed to answer a simple question in one glance: how well did I sleep last night?
But the number is not a direct measurement of your brain's sleep architecture. It is a proprietary algorithm that combines three separate inputs — duration, sleep quality (stage time), and restoration (how your heart rate behaves overnight) — into a single composite metric. The score is derived entirely from accelerometry (movement) and photoplethysmography (heart rate) data. It does not measure brain waves, which means it estimates sleep stages rather than detecting them directly.
Understanding what goes into that number — and what does not — is the first step toward using it productively rather than being confused or frustrated by it.
The Three Sub-Components: Duration, Quality, and Restoration
Fitbit breaks the sleep score into three sub-scores, though the company does not publicly disclose the exact weighting formula that combines them. The three components are:
- Sleep Duration — The total time you spent asleep, not the time you spent in bed. This is the most straightforward component. Fitbit uses your movement and heart rate data to determine when you are actually asleep versus lying still while awake.
- Sleep Quality — The amount of time you spent in deep sleep and REM sleep, with these stages weighted more heavily than light sleep. Fitbit's algorithm considers longer stretches of deep and REM as higher quality, while frequent awakenings or long periods of light sleep lower this sub-score.
- Restoration — How much your sleeping heart rate drops below your daytime resting heart rate. A lower sleeping heart rate relative to your baseline is interpreted as better physiological recovery. This is the least intuitive component for most users, but it is the one most directly tied to cardiovascular data rather than movement.

Because the algorithm is proprietary and may change with firmware updates, the same night of sleep could theoretically produce a different score after a software update. This is worth keeping in mind if you notice your scores shifting without any change in your actual sleep patterns.
Score Ranges: What the Numbers Actually Mean
Fitbit assigns your sleep score to one of four ranges, each with a label and a plain-language interpretation. These ranges are Fitbit's internal benchmarks, not clinical thresholds validated by sleep medicine organizations.
| Score Range | Label | What It Typically Means |
|---|---|---|
| 90–100 | Excellent | You likely got enough sleep, with sufficient deep and REM time, and your heart rate dropped well below your resting baseline. |
| 80–89 | Good | A solid night. You probably met your basic sleep needs, though one sub-component may have been slightly below ideal. |
| 60–79 | Fair | Adequate but not optimal. One or two sub-components (often duration or quality) were below your personal average. |
| Below 60 | Poor | Significant disruption. You likely had very short sleep, frequent awakenings, or a high sleeping heart rate relative to your baseline. |
The average user falls in the 72–83 range, according to Fitbit's aggregated data. If your scores consistently land in the 60s, it may be worth examining your sleep habits — but it is equally possible that the algorithm simply does not align well with your physiology.
How the Score Is Calculated Step by Step
While the exact algorithm is proprietary, the general calculation process follows a consistent sequence each night:
- Data collection: Throughout the night, the device's accelerometer tracks movement while the optical heart rate sensor records pulse data at regular intervals.
- Sleep/wake estimation: Fitbit's algorithm uses a combination of movement patterns and heart rate variability to estimate when you are asleep versus awake. This step determines total sleep time.
- Stage classification: The algorithm then estimates time spent in light, deep, and REM sleep. This is the most technically challenging step, as it relies on heart rate patterns rather than the brain wave data that clinical polysomnography uses.
- Duration scoring: Your total sleep time is compared against age-based recommendations to produce a duration sub-score.
- Quality scoring: The algorithm evaluates how much time you spent in deep and REM sleep relative to your total sleep time, with longer continuous stretches of these stages earning higher scores.
- Restoration scoring: Your average sleeping heart rate is compared to your daytime resting heart rate. A larger drop is interpreted as better physiological recovery.
- Composite score: The three sub-scores are combined into the final 0–100 number using Fitbit's proprietary weighting formula.
Why the Score May Not Reflect How You Actually Feel
The sleep score is a useful trend indicator, but it has documented accuracy limitations that every user should understand. The most relevant data comes from a 2024 single-night inpatient study conducted by Brigham & Women's Hospital and Harvard Medical School, which compared the Fitbit Sense 2 against gold-standard polysomnography (PSG) in 35 healthy adults aged 20–50.
| Metric | Fitbit Sense 2 vs. PSG |
|---|---|
| Light sleep estimation | Overestimated by ~18 minutes (p < 0.001) |
| Deep sleep estimation | Underestimated by ~15 minutes (p < 0.001) |
| Overall sleep stage agreement | Moderate (κ = 0.55) |
| Light sleep sensitivity | 78.0% |
| Deep sleep sensitivity | 61.7% |
| REM sleep sensitivity | 67.3% |
| Data recording failure | 2 of 35 participants had no data recorded despite device being charged |
Additional research from Liang et al. (2019), published in JMIR, tested the Fitbit Charge 2 under free-living conditions and found that accuracy was significantly affected by the user's sleep quality. Participants with better sleep quality (PSQI < 5) showed different error patterns than those with poorer sleep quality. Wake after sleep onset (WASO) and sleep efficiency (SE) also influenced how accurately the device tracked stage transitions.
What this means for your sleep score: if you have naturally light or fragmented sleep, the algorithm may systematically misclassify your sleep stages, producing a score that does not match your subjective experience. The score is a reasonable tool for tracking week-over-week trends in the same person, but it is not accurate enough to compare against another person's score or to use as a clinical diagnostic.
The Orthosomnia Risk: When Tracking Hurts Sleep
There is a documented downside to having a daily sleep score: it can create anxiety about sleep that paradoxically makes sleep worse. This phenomenon has a name — orthosomnia — first described by Baron et al. in the Journal of Clinical Sleep Medicine in 2017.
Orthosomnia refers to the obsessive pursuit of optimal sleep data, driven by the belief that if the numbers are not perfect, something is wrong. Common behaviors include staying in bed longer than needed to improve duration scores, feeling anxious about a single low score, and trusting the tracker's data over how you actually feel upon waking.
The risk is not trivial. Approximately 30% of U.S. adults now use wearable devices for health data, according to the Sleep Foundation. For individuals with pre-existing insomnia or health anxiety, the daily feedback loop of a sleep score can reinforce the very vigilance that maintains insomnia. A 2021 study cited by the Sleep Foundation found that consumer trackers accurately identified deep sleep only 59% of the time — meaning the data driving your anxiety may not even be correct.
Practical Tips for Using the Score Wisely Without Obsessing
The goal is to use the sleep score as a loose guide without letting it become a source of stress. These strategies can help maintain a healthy relationship with the data:
- Focus on weekly trends, not daily scores. A single night of poor sleep is normal. Look at your average score over the past 7 or 30 days instead of reacting to each morning's number.
- Hide the score if it causes anxiety. The Fitbit app allows you to customize your dashboard. If seeing the score first thing in the morning triggers stress, remove it from your main view and check it only when you feel ready.
- Take regular tracker holidays. One or two nights per week without wearing the device can break the feedback loop and help you reconnect with how you actually feel upon waking.
- Prioritize subjective sleep quality. How do you feel when you wake up? Are you alert enough to function during the day? If your subjective experience is good, a low score is likely an algorithm error, not a real problem.
- Use the score as a conversation starter with a doctor. If your scores are consistently poor over several weeks, bring the trend data to a healthcare provider. Do not use the score as a self-diagnosis tool.
Fitbit Premium vs. Free Features: Does More Data Help?
The basic sleep score is available to all Fitbit users without a subscription. Fitbit Premium adds a monthly sleep profile, a 10-metric breakdown of your sleep patterns, and personalized sleep guidance based on your data.
| Feature | Free | Premium |
|---|---|---|
| Daily sleep score (0–100) | Yes | Yes |
| Sleep stage breakdown | Yes | Yes |
| Sleeping heart rate graph | Yes | Yes |
| Monthly sleep profile | No | Yes |
| 10-metric sleep analysis | No | Yes |
| Personalized sleep guidance | No | Yes |
Whether Premium helps or harms depends entirely on your relationship with sleep data. For a curious user who wants to understand long-term patterns without fixating on daily fluctuations, the monthly sleep profile can provide useful context. For someone already prone to checking their score anxiously, the additional metrics may amplify orthosomnia tendencies.
Before upgrading, ask yourself: do I currently feel calm about my sleep data, or does it make me more worried? If the answer is the latter, more data is unlikely to help.
Comments
Join the discussion with an anonymous comment.