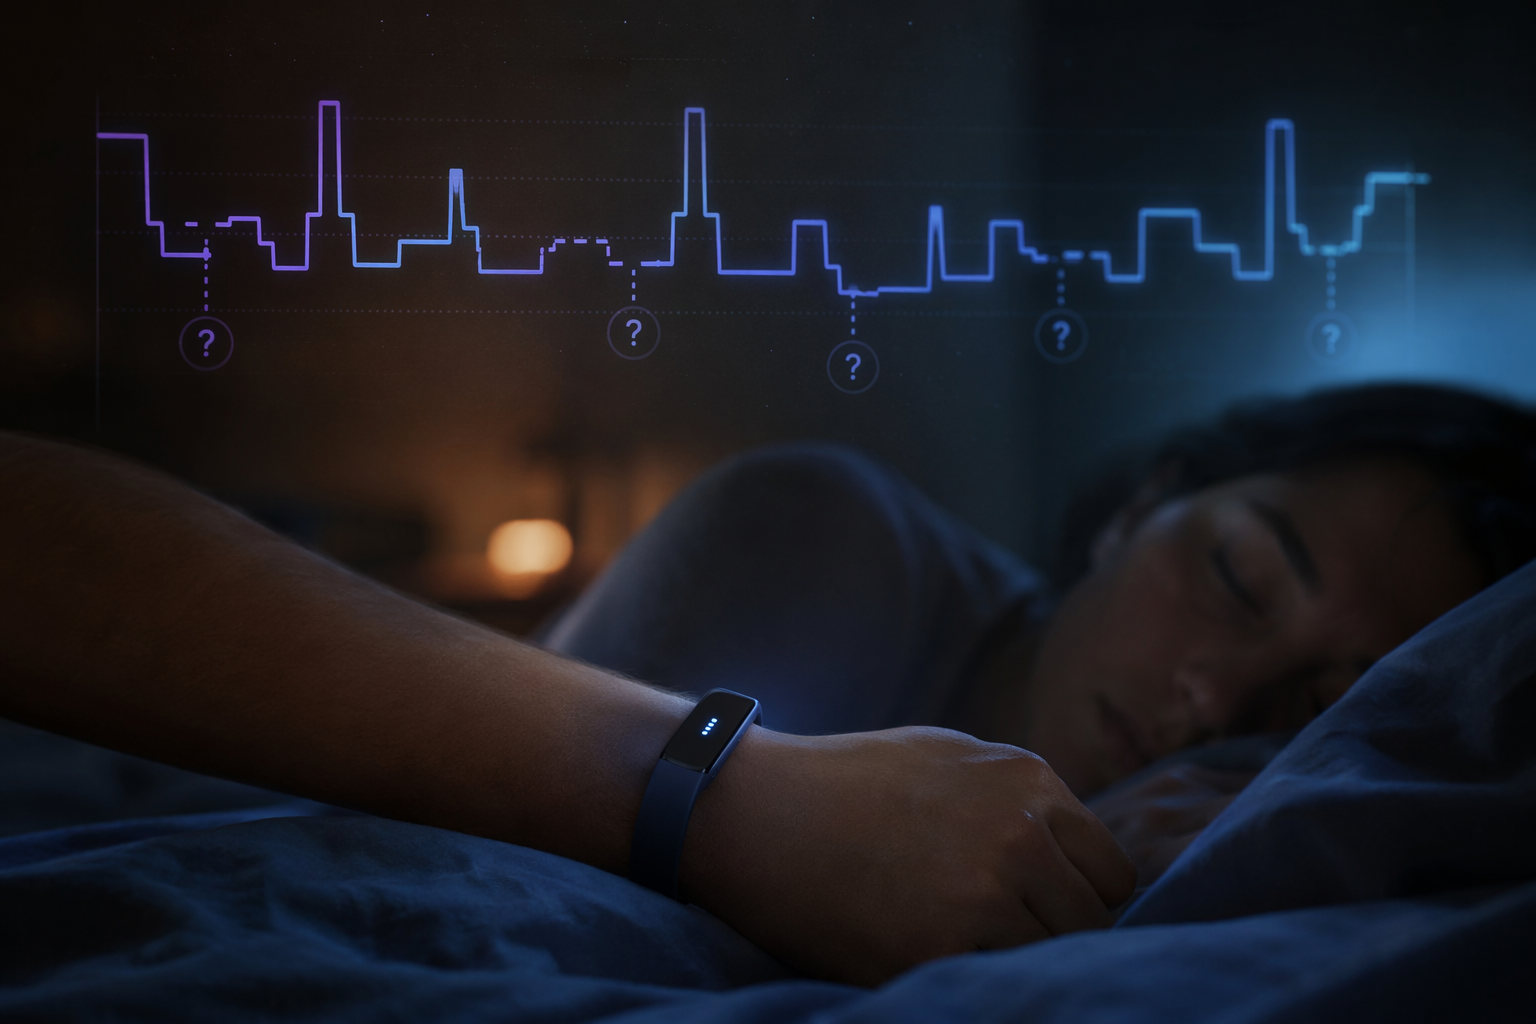
The useful question about a Fitbit sleep tracker is not whether it is “accurate” in one big, comforting sense. It is which parts of the graph are solid enough to use, and which parts only look solid because the app gives them clean labels and exact-looking minutes.
The short version from the peer-reviewed validation literature is this: Fitbit does reasonably well at detecting sleep in broad strokes, especially when the question is “was I mostly asleep or awake?” Across newer validation work, overall epoch-by-epoch agreement with polysomnography, or PSG, sits in the high 80% range, and sleep/wake sensitivity is reported at 95% or higher.[1] That sounds reassuring until you look at what the number mostly rewards: identifying sleep when sleep is present. It does not mean the device can reliably reconstruct your sleep architecture.

That distinction matters because most overreaction happens at the stage level. Total sleep time can be close enough to notice broad patterns over several weeks. A single-night deep sleep number, a missing REM block, or a low wake estimate is a different kind of claim. The current evidence is much less kind to those claims.
The broad sleep line is stronger than the stage graph
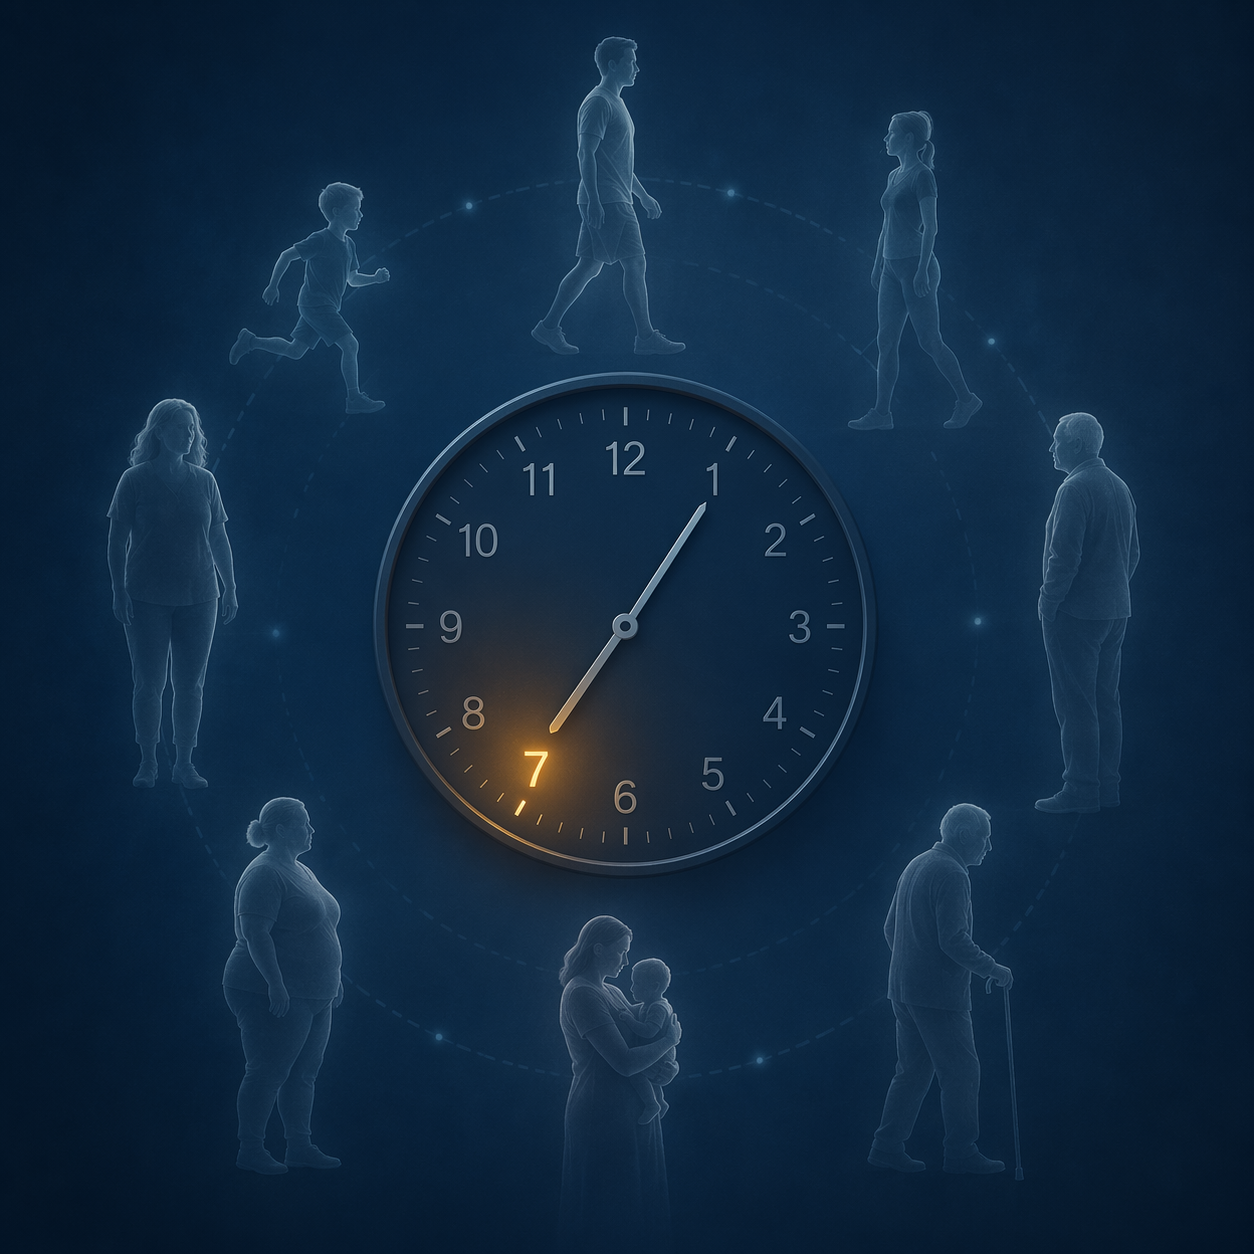
Fitbit’s best-supported use is not sleep diagnosis. It is a consumer-grade trend line: bedtime regularity, approximate total sleep time, and whether your average sleep duration is drifting up or down. That is where a wrist device has a chance to be genuinely useful, especially for healthy adults who are not asking it to detect a sleep disorder.
The older pooled validation literature already showed the shape of the problem. In a systematic review and meta-analysis comparing Fitbit devices with PSG and actigraphy, Fitbit showed high sensitivity for detecting sleep, ranging from 87% to 99%, but much weaker specificity for detecting wake, ranging from 10% to 52%.[2] In plain terms: Fitbit is much better at saying “sleep” when you are asleep than at saying “wake” when you are awake.
That asymmetry is why the total sleep line can look plausible while the wake and stage details feel off. A tracker that misses quiet wakefulness can inflate sleep duration, smooth over awakenings, and then distribute that estimated sleep into stages that appear more clinical than they really are.
A 2024 review in Journal of Sleep Medicine reported the same general bias pattern across Fitbit validation studies: Fitbit tended to overestimate total sleep time by 7 to 67 minutes, overestimate sleep efficiency by 2% to 15%, and underestimate wake after sleep onset by 6 to 44 minutes.[3] Those ranges are too wide to turn into a personal correction factor. They are useful because they show the direction of the problem: the device often makes sleep look more continuous than PSG does.
| Metric | What the evidence suggests | How to use it |
|---|---|---|
| Total sleep time | Often close enough for broad trends, but can be overestimated | Compare weekly averages, not single nights as exact totals |
| Sleep vs. wake | High sleep sensitivity, weak wake specificity | Treat missed awakenings as a known limitation |
| Light sleep | Often overestimated | Do not interpret a long light-sleep bar as a precise physiological finding |
| Deep sleep | Often underestimated and poorly correlated with PSG | Do not make next-day decisions from one deep-sleep number |
| REM sleep | Moderate classification at best, with poor agreement in some validation metrics | Look for broad patterns only, if at all |
Where the stage data starts to wobble
The more relevant test for the morning graph is stage-by-stage validation against PSG. PSG is not perfect in some philosophical sense, but it is the clinical reference standard used in sleep labs. If a device says you had 42 minutes of deep sleep, the important question is not whether the app can produce a number. It is whether that number tracks reasonably with PSG across real nights.
A 2024 Brigham & Women’s Hospital study compared several current consumer wearables with PSG in 35 participants. For Fitbit Sense 2, reported stage sensitivity was 78% for light sleep, 61.7% for deep sleep, and 67.3% for REM sleep.[4] The study found Oura Ring outperformed Fitbit across the sleep-stage comparisons, but that comparison needs to be read with the conflict plainly attached: the study was funded by Oura Ring Inc.[4]
That conflict does not make the Fitbit findings disappear. It does mean the device-to-device ranking deserves some caution. The more important point is that the Fitbit stage numbers were not close enough to justify treating a single night’s stage breakdown as a reliable map of the night.
Another comparison reported four-stage classification agreement using Cohen’s kappa, where Fitbit reached 0.55 against PSG, compared with 0.65 for Oura and 0.60 for Apple Watch.[5] A kappa of 0.55 is usually described as moderate agreement. Moderate is not useless. It is also not the kind of agreement that should make someone reorganize their morning around whether they got “enough” deep sleep.
The intraclass correlation coefficients are more sobering for individual stage estimates. In the 2024 validation literature, Fitbit’s ICC versus PSG was poor for deep sleep at 0.36 and poor for REM at 0.13.[1] ICC is not as intuitive as minutes, but the implication is simple: nightly stage estimates can diverge widely from the reference measurement, even when the app presents them as crisp blocks.

Light sleep tends to run long
Fitbit commonly overestimates light sleep. Across the evidence summarized here, the bias is roughly 18 minutes per night. This is not a harmless cosmetic issue, because light sleep is often where uncertainty gets parked. If the device is unsure how to classify a quiet period, the result can be a longer light-sleep band that feels plausible but is doing too much work.
Part of this is structural. Fitbit’s consumer sleep-stage display uses a simplified non-REM model: “light sleep” combines N1 and N2, while “deep sleep” corresponds to N3.[6] PSG scoring separates N1, N2, and N3. Combining N1 and N2 is not automatically wrong for a consumer display, but it makes the app’s categories look more clinically specific than they are.
Deep sleep tends to run short
Deep sleep is the number people often care about most, and it is one of the least safe numbers to overinterpret. The synthesis reports that Fitbit underestimates deep sleep by about 15 minutes per night. The Brigham study’s 61.7% sensitivity for deep sleep on Fitbit Sense 2 points in the same direction: many true deep-sleep epochs are not being captured as deep sleep by the device.[4]
This is where precision becomes emotionally misleading. “38 minutes of deep sleep” sounds like a measurement. In practice, it may be a rough classifier output with enough error that the exact number should not carry much weight. If your Fitbit shows unusually low deep sleep on one night, the evidence does not support treating that as proof that your body failed to recover.
Wake detection is the quiet failure point
Wake is less glamorous than REM or deep sleep, but it is central to the accuracy problem. Fitbit’s weak wake specificity means it can miss periods when a person is awake but still. That matters for people who lie in bed quietly, wake during the night without getting up, or experience fragmented sleep that does not announce itself with obvious movement.
The 10% to 52% specificity range from the meta-analysis is the cleanest warning sign here.[2] A device can have excellent sensitivity for sleep and still perform poorly at identifying wake. Those two facts can coexist, and they explain why a Fitbit report can feel broadly right while still understating how broken up the night actually was.
Why weekly trends are safer than nightly stage audits
A noisy measure is not automatically useless. If the same device is worn consistently, under similar conditions, broad movement in the same metric may still carry practical information. A person whose Fitbit average sleep time drops from around seven and a half hours to around six hours over several weeks should probably take that seriously, even if no single night is exact.

The safer use is pattern recognition: later bedtimes, shorter sleep opportunity, more variable schedules, or a sustained drop in estimated total sleep. The unsafe use is nightly architecture auditing: deciding that Tuesday was a recovery failure because deep sleep was low, or that a night was excellent because the app showed very little wake.
This also explains why model-by-model debates only help up to a point. The Journal of Sleep Medicine review reported variation between Fitbit models; for example, in obstructive sleep apnea patients, Charge 3 showed 87.4% sensitivity and 35% specificity, while Alta HR showed 88.1% sensitivity and 51.9% specificity.[3] That kind of variation matters, but it does not overturn the larger pattern: consumer wrist devices are better at estimating sleep than at detecting wake and staging sleep precisely.
Fitbit’s proprietary algorithm also limits what independent researchers and users can verify. The app gives outputs, not raw access to the full decision process. That does not make validation impossible, but it does mean the user cannot inspect why a quiet awakening became light sleep or why a block of N3 was missed.
For readers comparing devices, the better question is usually metric-specific rather than brand-loyal. A broader device-by-device breakdown belongs in a separate comparison, such as a metric-level sleep wearable accuracy comparison. For Fitbit specifically, the practical takeaway is narrower: trust the long trend more than the nightly sleep-stage story.
The caveat gets bigger if sleep is already disrupted
The cleanest Fitbit accuracy claims usually come from healthier adult samples. Once insomnia, sleep apnea, or other sleep-disordered patterns enter the picture, the risk of misleading estimates rises. Quiet wakefulness, fragmented sleep, respiratory events, and atypical movement patterns are exactly the situations where a wrist tracker has less information than PSG.
That is why a Fitbit sleep tracker should not be treated as a clinical assessment. If the concern is insomnia, sleep apnea, unusual daytime sleepiness, or repeated awakenings, the Fitbit graph can be a note to bring into a conversation, not the evidence that settles the question.
There is also a behavioral risk in giving stage numbers too much authority. Some people begin trying to optimize the graph rather than sleep itself. If that is the issue, the next useful reading is not another stage chart; it is a practical guide to using the score without letting it run the morning, such as how Fitbit Sleep Score is calculated and how to use it.
What to believe tomorrow morning
Believe the Fitbit most when it is telling you about broad sleep duration patterns under ordinary conditions. Be more skeptical when it claims to know, minute by minute, how much light, deep, REM, and wake you had last night.
The best-supported use is boring but helpful: wear it consistently, compare averages over weeks, and look for changes large enough to matter in daily life. The least supported use is treating a single deep-sleep number, REM total, or wake estimate as a verdict on recovery.
Fitbit can give you a useful trend line. The stage story is too biased and too unstable to audit your sleep architecture one night at a time.
References
- Robbins et al., Sensors 2024
- Fitbit-Based Sleep Monitoring: A Systematic Review and Meta-Analysis, JMIR, 2019
- Journal of Sleep Medicine review of wearable sleep trackers, Journal of Sleep Medicine, 2024
- Brigham & Women’s Hospital / Harvard wearable sleep-tracker validation study, 2024
- Oura Ring, Apple Watch, Fitbit Face Off in Sleep Accuracy Study, Sleep Review
- Fitbit and Google Health sleep stages documentation, Google Health
Comments
Join the discussion with an anonymous comment.