
Introduction: The Garmin Sleep Data Paradox
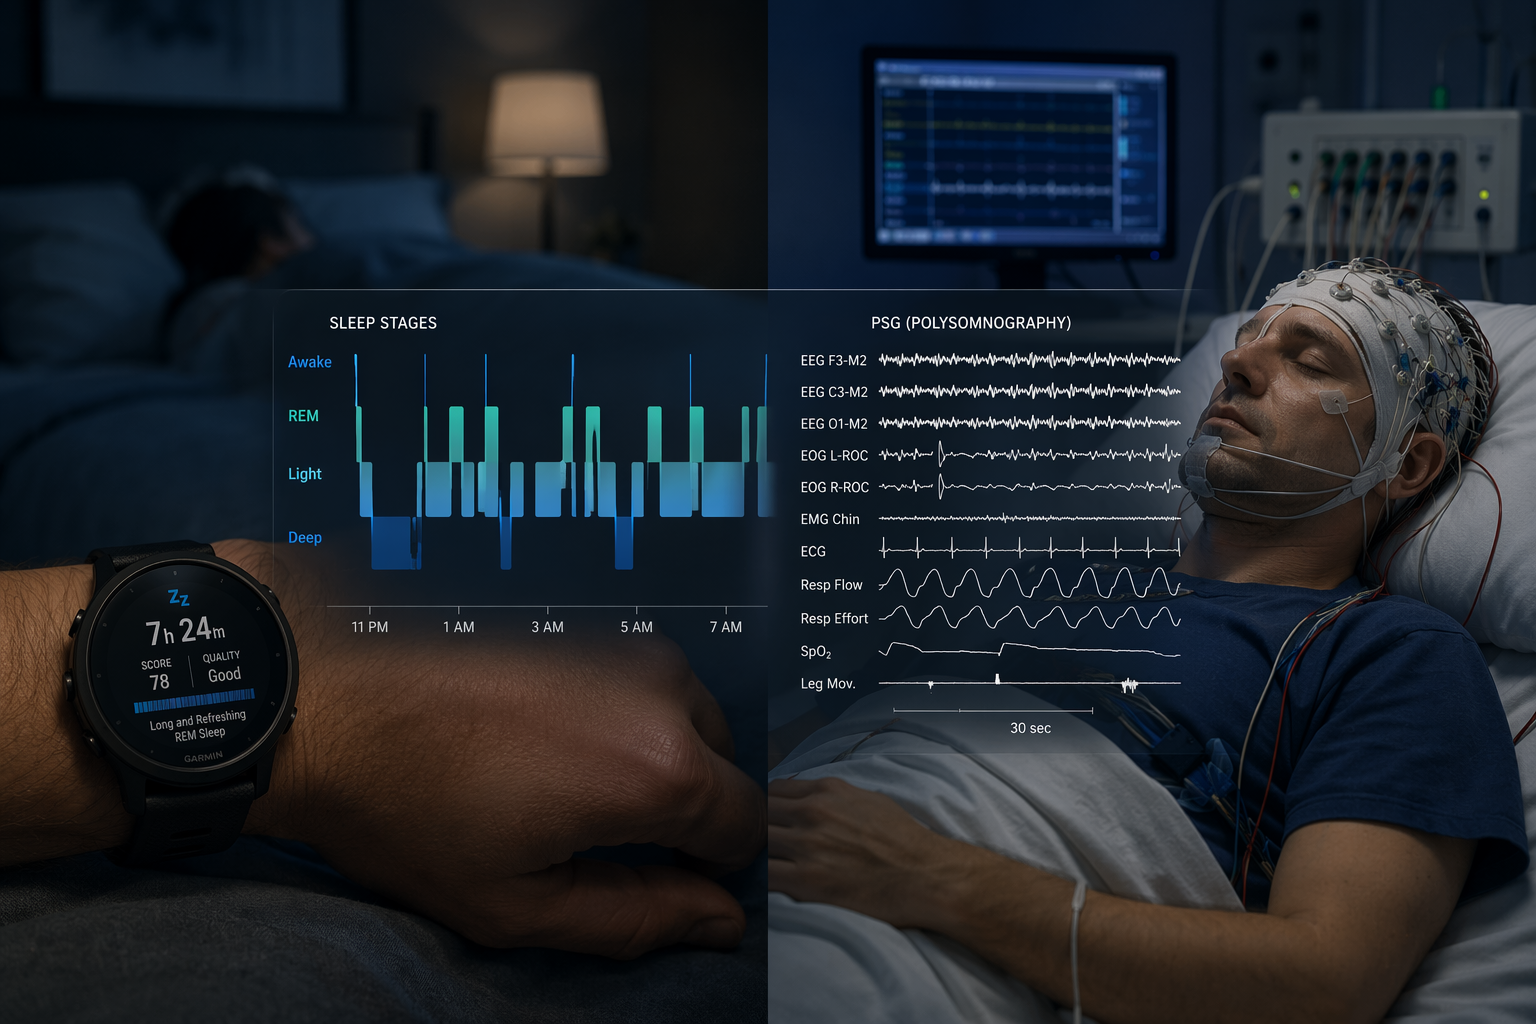
Every morning, millions of Garmin watch owners wake up to a neatly packaged sleep report: total sleep time, a breakdown of light, deep, and REM stages, a sleep score out of 100, and a Body Battery charge level. The data looks precise. It feels authoritative. And because Garmin delivers it consistently — night after night — it is easy to assume the numbers are accurate.
But the latest research tells a more complicated story. A 2026 head-to-head study from the University of Salzburg tested Garmin's current-generation watches against polysomnography (PSG), the clinical gold standard for sleep measurement, and ranked Garmin 6th out of 7 top wearables for sleep stage classification accuracy, at approximately 63.4%. That places it behind the Oura Ring 3 (72.5%), the Apple Watch Series 9 (72.3%), and the Fitbit Charge 6 (66.2%), among others.
Yet paradoxically, Garmin also leads the field in something equally important: consistency. Real-world data from Terra Research, analyzing over 669 Garmin users, found that Garmin produced the tightest standard deviation in nightly sleep time and the lowest outlier rates — under 1.5% across most metrics. In plain language: Garmin may not tell you exactly which sleep stage you are in at any given moment, but it is remarkably reliable at tracking whether your sleep duration is stable or trending in the wrong direction.
This article is a 2026-focused evidence update. It builds on our broader Garmin Sleep Tracking overview by zeroing in on the sharpest available data: Garmin's own sponsored validation study, independent peer-reviewed research, the new Salzburg head-to-head comparison, and real-world consistency benchmarks. The goal is to help you understand exactly which parts of your Garmin sleep data to trust — and which to treat with a healthy dose of skepticism.
How Garmin Watches Track Your Sleep: Sensors and Algorithm
Before diving into the accuracy numbers, it helps to understand what is happening under the watch face. Garmin's advanced sleep tracking — available on most models produced after 2018 — relies on three primary data streams:
- Optical heart rate sensor (PPG): Measures blood volume changes at the wrist to calculate heart rate and heart rate variability (HRV). This is the primary input for distinguishing between sleep stages.
- Accelerometer: Detects gross body movement. When movement is minimal, the algorithm assumes sleep; when movement spikes, it may register wakefulness or a stage transition.
- HRV-derived stress/recovery analysis: Garmin's Firstbeat Analytics engine uses HRV patterns to estimate autonomic nervous system balance — a signal that correlates with sleep depth and overnight recovery.
Current-generation models — the Fenix 8, Venu 3, and Forerunner 965 — use Garmin's Elevate 4 or Elevate 5 optical sensor. These sensors represent a significant hardware improvement over the Elevate 3 sensor found in older models like the Vivosmart 3 and Fenix 5S, which were the subjects of much of the earlier independent research.
The algorithm itself uses a two-stage neural network architecture. According to Garmin's 2019 validation study, over 60 features are processed on-device, with an additional 7 features computed in the cloud. The system combines movement, heart rate, HRV, age, and personal baseline data to classify each 30-second or 60-second epoch as wake, light sleep, deep sleep, or REM.
Garmin's Own Validation Study (2019): 69.7% Accuracy
The most optimistic picture of Garmin's sleep tracking accuracy comes from Garmin itself. In 2019, the company published a validation study comparing the Garmin Vivosmart 3 against a Sleep Profiler EEG reference — a clinical-grade device that uses forehead electrodes to measure brain activity, eye movement, and muscle tone.
The study enrolled 55 participants (69% male, mean age 35.5, mean BMI 26.3) who wore both devices during real-world home sleep over multiple nights. The headline result: Garmin's overall epoch-by-epoch accuracy was 69.7%, with a Cohen's kappa of 0.54 — a moderate level of agreement. Sensitivity (correctly detecting sleep when the reference said sleep) was 95.8%, and specificity (correctly detecting wake when the reference said wake) was 73.4%.
The confusion matrix from the study reveals where the algorithm struggles most:
| True Stage (Sleep Profiler) | Misclassified As | Misclassification Rate |
|---|---|---|
| Deep sleep | Light sleep | 29.1% |
| REM sleep | Light sleep | 26.4% |
| Wake | Light sleep | 14.9% |
The study also noted that the worst-case accuracy among participants was just 49.9% (kappa 0.18) — recorded in a participant with a self-reported sleep disorder. For context, inter-scorer agreement between trained PSG technicians reading the same raw data is approximately 83% (kappa 0.78).
What Independent Research Reveals: Chinoy (2021) and Kainec (2024)
When independent researchers put Garmin devices through the same kind of testing, the results are considerably less flattering. Two peer-reviewed studies — Chinoy et al. (2021) and Kainec et al. (2024) — tested older Garmin models against full polysomnography and found systematic biases that raise serious questions about stage-level accuracy.
Chinoy et al. (2021): Garmin Ranks Last Among 7 Devices
Published in Sleep, this study tested 34 healthy adults across three nights — including a night of experimentally disrupted sleep — comparing seven consumer devices against PSG. The Garmin Fenix 5S and Vivosmart 3 were included.
| Metric | Garmin Fenix 5S | Garmin Vivosmart 3 |
|---|---|---|
| TST overestimation vs. PSG | 43.7 min (p<0.001) | 46.8 min (p<0.001) |
| Sleep Efficiency overestimation | 10.6% (p<0.001) | 10.1% (p<0.001) |
| WASO underestimation | 49.5 min (p<0.001) | 47.6 min (p<0.001) |
| Wake specificity (epoch-by-epoch) | 0.18 | 0.19 |
| Light sleep overestimation | 29.0 min (p<0.001) | 34.7 min (p<0.001) |
The most striking finding was wake specificity: 0.18 and 0.19, respectively — the lowest of all seven devices tested. (For comparison, the Fitbit Alta HR scored 0.54, and even research-grade actigraphy scored 0.39.) This means Garmin's algorithm missed approximately 80% of brief awakenings, classifying them as light sleep instead. The study concluded that the two Garmin devices were the worst-performing of the seven tested, ranking last on most performance metrics.
Kainec et al. (2024): Garmin Vivosmart 4 — Largest TST Bias Tested
A more recent study published in JMIR mHealth and uHealth tested 53 young adults (mean age 22.5) for one in-lab night. The Garmin Vivosmart 4 overestimated total sleep time by a mean of 41.7 minutes (ICC = 0.38, classified as poor agreement). Wake after sleep onset (WASO) was drastically underestimated: the device reported a mean of 7.2 minutes vs. PSG's 33.1 minutes (ICC = 0.08). REM sleep was overestimated by 39.2 minutes (ICC = 0.06, effectively no agreement).
The Kainec study also noted a 5.6% data loss rate across Garmin devices (2 sync failures, 1 poor fit), and concluded that the Garmin Vivosmart 4 was the only device tested that did not estimate total sleep time comparably to research-grade actigraphy.
The 2026 University of Salzburg Study: Garmin Ranks 6th Out of 7 at 63.4%
The most current and directly relevant evidence comes from a 2026 study conducted by researchers at the University of Salzburg (in collaboration with The Quantified Scientist). This study tested 15 consumer wearables against home-based ambulatory PSG in 18 participants over 5 consecutive nights, including both restricted and extended sleep conditions — making it the most ecologically valid head-to-head comparison available.

| Device | Epoch-by-Epoch Accuracy | Cohen's Kappa (κ) |
|---|---|---|
| sleep² + Polar H10 | 84.0% | 0.76 |
| sleep² + Polar VS | 83.7% | 0.76 |
| Oura Ring 3 | 72.5% | 0.59 |
| Apple Watch Series 9 | 72.3% | 0.56 |
| Fitbit Charge 6 | 66.2% | 0.47 |
| WHOOP 4 | 65.2% | 0.48 |
| Garmin Vivoactive 6 & Venu 3 | 63.4% | 0.41 |
| Circul+ | 55.6% | 0.33 |
Several findings stand out. First, both the Garmin Vivoactive 6 (Elevate 4 sensor) and the Garmin Venu 3 (Elevate 5 sensor) performed identically at 63.4% accuracy. This strongly suggests that the limitation is algorithmic rather than sensor-dependent — a conclusion echoed by Garmin forum power users who note that the Venu 3 and Fenix 8 share the same algorithm stack. Second, Garmin was described by the study authors as "consistently mid-to-low tier, performing worse than the leaders but better than the lowest-ranked devices." Third, the study found that error magnitude increased drastically on atypical nights — meaning the data is least reliable precisely when you might be most curious about it (e.g., after a late workout, a night of drinking, or travel).
Where Garmin Excels: Total Sleep Time Consistency and Long-Term Trends
If the stage accuracy picture looks bleak, the consistency picture tells a very different story. Terra Research, a data platform that aggregates real-world wearable data, analyzed sleep records from 669 Garmin users alongside 2,581 Oura users, 1,086 Apple Watch users, and 620 Fitbit users. The results reveal a clear strength: Garmin is the most consistent tracker in the group.

| Metric | Garmin | Apple Watch | Fitbit | Oura Ring |
|---|---|---|---|---|
| Average nightly sleep | 7.17 hours | 6.68 hours | 6.39 hours | 6.34 hours |
| Outlier rate | < 1.5% | Higher | Higher | Higher |
| Night-to-night variability | Lowest (tightest SD) | Moderate | Moderate | Moderate |
| Stage composition (deep/light/REM) | ~18% / 60-66% / 16.4% | ~10.5% deep | Varies | Varies |
Terra's conclusion is worth quoting directly: "Garmin produces the most consistent data" and is "the most reliable for long-term trend tracking." This makes intuitive sense: if a device systematically overestimates sleep time by a consistent amount each night, the trend — whether your sleep is improving, declining, or stable — remains interpretable. The absolute numbers may be off, but the direction of change is trustworthy.
Why Garmin Struggles with Sleep Stages: REM and Wake Detection
The pattern across all available research points to two specific weaknesses in Garmin's sleep staging algorithm: wake detection and REM classification.
Wake Detection: The 18% Specificity Problem
Garmin's wake specificity of 18-19% in the Chinoy study means the device correctly identified wakefulness only about one time out of five. The remaining 80% of brief awakenings were classified as light sleep. This has a cascading effect on other metrics:
- Total sleep time gets inflated because wake periods are counted as sleep.
- Wake after sleep onset (WASO) is drastically underestimated — Kainec found Garmin reported 7.2 minutes vs. PSG's 33.1 minutes.
- Sleep efficiency (time asleep / time in bed) is overestimated by roughly 10 percentage points.
This is not unique to Garmin — most wrist-worn wearables struggle with wake detection because the physiological signals of quiet wakefulness (still body, elevated heart rate) can resemble light sleep. But Garmin's performance in this area is notably worse than competitors.
REM Classification: Systematic Underestimation
Garmin's own 2019 confusion matrix shows that 26.4% of true REM sleep was misclassified as light sleep. The Kainec study found REM overestimation of 39.2 minutes (ICC = 0.06), indicating essentially no agreement with PSG for this stage. The 2026 Salzburg study similarly noted that Garmin struggled most with REM detection and consistency.
REM sleep is physiologically complex to detect from the wrist because it shares some autonomic characteristics with wakefulness (variable heart rate, irregular breathing) while the body is paralyzed. Accurate REM detection typically requires EEG-based measurement of rapid eye movements and muscle atonia — signals that wrist sensors cannot access directly.
Practical Factors That Worsen Accuracy
Several real-world factors can degrade Garmin's sleep tracking performance further:
- Loose watch fit: The single most consequential hardware factor. If the optical sensor loses consistent skin contact, the algorithm loses its primary data stream and defaults to movement-based estimation.
- Alcohol consumption: Alcohol inflates apparent deep sleep early in the night and suppresses REM. Garmin's algorithm may interpret the elevated HRV and reduced movement as deeper sleep than is actually occurring.
- Atypical nights: The 2026 Salzburg study found that error magnitude increases drastically on nights with restricted or extended sleep — precisely the nights when users are most likely to check their data.
- Sleep disorders: Garmin's own study noted that the worst-case accuracy (49.9%) occurred in a participant with a self-reported sleep disorder. None of the independent studies included participants with diagnosed conditions, so real-world performance for this population is unknown.
Practical Guidance: What to Trust and What to Ignore on Your Garmin
The evidence above paints a nuanced picture: Garmin is not a bad sleep tracker, but it is a tracker with specific strengths and specific limitations. Here is how to use your Garmin sleep data wisely.
Trust These Metrics
- Total sleep time trends: Garmin's consistency means that if your reported sleep time drops from 7.5 hours to 6.5 hours over a week, the trend is likely real — even if the absolute numbers are inflated by 40 minutes.
- Sleep/wake patterns: For detecting when you fell asleep and when you woke up, Garmin's high sensitivity (95.8%) means it rarely misses sleep when sleep is actually occurring.
- Sleep score as a directional signal: The 0-100 score combines duration, quality, and HRV-derived recovery. The average Garmin user scores 72 (classified as "fair"), and only 7% average "excellent" (90-100). Use the score to track week-over-week changes, not as an absolute measure of sleep health.
- Body Battery and Training Readiness: These metrics rely more on HRV and heart rate trends than on sleep stage classification, making them somewhat more robust to the stage accuracy limitations.
Treat These with Caution
- Specific stage breakdowns (deep, light, REM percentages): The error margins are too large for individual decision-making. A single night showing 20% deep sleep vs. 15% deep sleep is within the noise floor of the device.
- Single-night data: Error magnitude increases on atypical nights. Do not draw conclusions from one night's report, especially after travel, alcohol, or an unusual workout.
- Wake time and WASO: Garmin systematically underestimates how long you spend awake during the night. If you feel like you were awake for 30 minutes but your watch says 5 minutes, trust your subjective experience.
- REM time: The evidence shows poor agreement with PSG for REM classification. Do not use Garmin's REM numbers to evaluate sleep quality or dream recall.
The Bottom Line
Garmin sleep tracking occupies an unusual position in the wearable landscape. It is simultaneously one of the most consistent trackers for long-term trend monitoring and one of the least accurate for moment-to-moment stage classification. The 2026 evidence confirms that Garmin ranks 6th out of 7 top wearables at approximately 63.4% stage accuracy — a figure that has not meaningfully improved across sensor generations, suggesting the bottleneck is algorithmic rather than hardware.
But consistency is not nothing. For the typical Garmin user — an athlete, runner, or fitness-conscious adult who wants to know whether their sleep is stable, trending up, or trending down — the device delivers exactly that. The sleep score, Body Battery, and Training Readiness metrics, when interpreted as directional signals rather than absolute measurements, provide genuinely useful feedback.
The key is knowing the difference. Trust your Garmin for duration trends and sleep/wake patterns. Treat the stage breakdowns as rough estimates. And if you find yourself obsessing over whether you got 22% or 18% deep sleep last night, remember: the error margins on that number are larger than the difference you are trying to interpret.
For a deeper look at how the sleep score is calculated and what the numbers actually mean, see our Sleep Score Explained guide.
Comments
Join the discussion with an anonymous comment.