Open your wearable's app on any given morning and you are presented with a dashboard of numbers: a sleep score, time in deep sleep, resting heart rate, heart rate variability (HRV), respiratory rate, sleep latency, and sometimes a regularity score. The question that follows is rarely answered by the app itself: Which of these numbers should I actually care about?
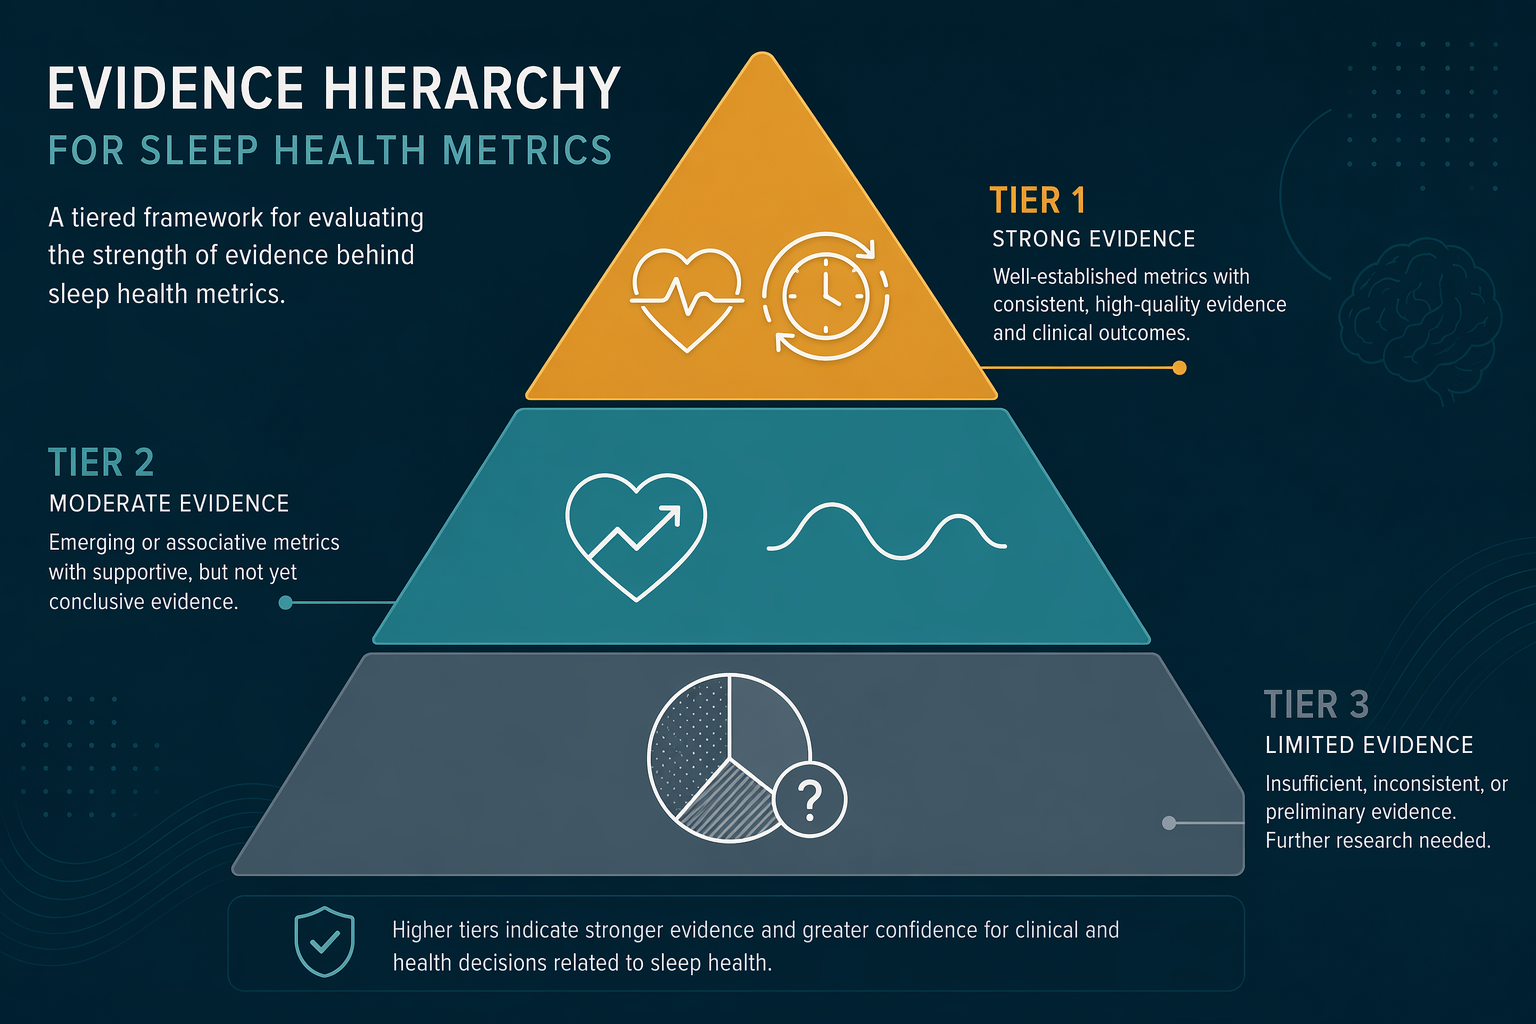
This article is not another device ranking. The site already covers which fitness trackers are most accurate for sleep staging and how rings compare to bands. Here, the focus shifts from the hardware to the data itself. The goal is to build a metric-evidence tier framework — a way to separate the metrics that have strong links to real health outcomes (cardiovascular events, mortality, infection detection) from those that are interesting but currently lack outcome validation. If you are trying to decide what to prioritize in your morning data review, this framework is designed to help.

Tier 1: Heart Rate Variability Trends Over 7+ Days
Heart rate variability — the variation in time between consecutive heartbeats — is the single most researched metric in consumer wearables for predicting health outcomes. The evidence is anchored by a 2013 meta-analysis by Hillebrand and colleagues, published in Europace, which pooled data from 8 studies and 21,988 participants without known cardiovascular disease. The finding: individuals with the lowest HRV had a 32–45% increased risk of a first cardiovascular event compared to those with the highest HRV. The pooled relative risk comparing the lowest to the highest level of SDNN (a standard HRV measure) was 1.35 (95% CI 1.10, 1.67).
This association extends beyond cardiovascular disease. A 2025 analysis of five longitudinal studies by Hernandez-Schneider and colleagues, published in Sensors, found that consumer wearable-derived resting HRV shows small-to-moderate associations with HbA1c (a marker of blood sugar control) and depressive symptoms. Another line of research has linked low HRV to systemic inflammation: a controlled endotoxemia study by Koeneman and colleagues showed that HRV changes detected inflammation before clinical symptoms appeared.
The key to making HRV data useful is time aggregation. The Texas Heart Institute review specifically notes that meaningful interpretations of longitudinal HRV data are improved by using weekly averages (7+ day rolling averages) of consecutive day-to-day recordings, which are superior to snapshot measures. A single low HRV reading could reflect a bad night of sleep, a glass of wine, or a stressful meeting. A seven-day rolling average smooths out those transient factors and reveals the underlying trend that correlates with actual health risk.

Tier 1: Sleep Regularity Index (SRI)
Sleep regularity — going to bed and waking up at consistent times — has emerged as one of the strongest wearable-measurable predictors of mortality. The landmark study here is Windred and colleagues' 2023 analysis of 60,977 UK Biobank participants, published in Sleep. Using over 10 million hours of accelerometer data, the researchers calculated a Sleep Regularity Index (SRI) for each participant and followed them over time. The results were striking: participants in the top four SRI quintiles had a 20% to 48% lower risk of all-cause mortality compared to the least regular quintile. The associations held for cancer mortality (16–39% lower risk) and cardiometabolic mortality (22–57% lower risk). Critically, sleep regularity was a stronger predictor of all-cause mortality than sleep duration.
The cardiovascular-specific evidence is equally compelling. The Multi-Ethnic Study of Atherosclerosis (MESA), published in the Journal of the American College of Cardiology in 2020, followed 1,992 participants free of cardiovascular disease for a median of 4.9 years. Those with the most irregular sleep timing (sleep onset standard deviation >90 minutes) had a 2.11 times higher risk of cardiovascular events compared to those with the most regular timing (SD ≤30 minutes). This association was independent of traditional risk factors and sleep duration.
For readers who want a deeper dive into the behavioral side of sleep regularity — why it matters physiologically and how to improve it — the site has a dedicated guide on why sleep regularity might matter more than how many hours you get. The focus here is on how wearables quantify it and what the outcome data shows.

Tier 2: Resting Heart Rate Trends During Sleep
Resting heart rate (RHR) during sleep is a Tier 2 metric — strong evidence, but the data is more associative than the HRV-mortality link. The most relevant consumer wearable data comes from the Apple Heart & Movement Study, which has published state-level analyses linking elevated nocturnal RHR to metabolic syndrome, hypertension, and cardiovascular risk. A persistently elevated nocturnal RHR is associated with a 55% greater risk of cardiovascular death in general population studies.
The key distinction is nocturnal RHR versus daytime RHR. During healthy sleep, the parasympathetic nervous system dominates, and heart rate drops 10–20% below daytime resting levels. A nocturnal RHR that stays elevated — or trends upward over weeks — can signal autonomic imbalance, overtraining, insufficient recovery, or underlying metabolic issues. Wearables that capture RHR throughout the night (rather than a single morning reading) provide a more stable signal because they average across the full sleep period, minimizing the effect of brief arousals or movement.
Tier 2: Respiratory Rate Variability
Respiratory rate (RR) during sleep is one of the most underappreciated metrics in consumer wearables, largely because its clinical utility for early infection detection has only recently been demonstrated. The most cited study is Rentería and colleagues' 2023 analysis of NCAA Division I female athletes wearing WHOOP bands, published in Sports Health. The finding: respiratory rate increased by 0.7 standard deviations (p = 0.02) 3 days before a positive COVID-19 PCR test, and by 3.2 standard deviations (p < 0.01) on the test day itself. Resting heart rate and HRV also changed, but RR was the earliest and most consistent signal.
What makes RR particularly useful as a wearable metric is its low day-to-day variability. In the WHOOP study, baseline RR had a mean standard deviation of just 0.39 breaths per minute. This means a relatively small increase — a ≥17% change from baseline — is statistically significant and actionable. Compare this to HRV, which can vary 20–30% day-to-day due to diet, exercise, and stress, and the advantage of RR as a stable early-warning signal becomes clear.
Tier 3: Sleep Stage Classification (Light, Deep, REM)
Sleep stage data — the breakdown of your night into light sleep, deep sleep, and REM — is the most visually prominent metric in most wearable apps. It also has the weakest evidence linking it to real health outcomes. This is not to say sleep stages are unimportant — deep sleep and REM are biologically essential — but the specific durations reported by consumer wearables have not been validated against hard endpoints like mortality or disease incidence in large-scale studies.
The problem is compounded by device disagreement. Terra Research, a commercial analytics company, analyzed 77,000+ nights across six devices, including 2,144 same-night comparisons from 725 users who wore multiple devices simultaneously. The results: on the same night, trackers differed by an average of ~32 minutes for deep sleep, ~23 minutes for REM, and ~38 minutes for light sleep. Deep sleep ranged from approximately 0.8 to 1.3 hours per night depending on which device was reporting. If two devices cannot agree on how much deep sleep you got on the same night, the clinical utility of that specific number is limited.
For readers interested in specific device-based clinical features — such as the Apple Watch's FDA-cleared breathing disturbances feature for sleep apnea detection — the site has a dedicated explainer on what the Apple Watch sleep apnea approval means and how to use it. That is a different use case — clinical screening for a specific condition — from the general health outcome framework discussed here.
How to Use This Framework for Device Selection
The metric-evidence tier framework is designed to help you choose a device based on what you actually want to track, not which device has the most features. The table below maps each tier to the metrics, the evidence strength, and the type of user who should prioritize it.
| Tier | Metrics | Evidence Strength | Best For |
|---|---|---|---|
| Tier 1 | HRV (7+ day rolling average), Sleep Regularity Index | Strong: linked to all-cause mortality, CVD risk, cancer mortality in large cohort studies (UK Biobank, MESA, Hillebrand meta-analysis) | Readers focused on long-term health risk assessment and mortality prevention |
| Tier 2 | Nocturnal resting heart rate trends, Respiratory rate variability | Strong: linked to CV death risk, metabolic syndrome, early infection detection in controlled studies (Apple Heart Study, WHOOP COVID study) | Readers monitoring recovery, metabolic health, or early illness detection |
| Tier 3 | Sleep stage durations (light, deep, REM) | Limited: no large-scale outcome studies; high device disagreement (~32 min deep sleep variation on same nights) | Readers interested in trend tracking within the same device, not clinical interpretation |
If your primary concern is long-term cardiovascular health and mortality risk, prioritize a device that provides reliable HRV data and a sleep regularity index — and that allows you to export or view 7+ day rolling averages. If you are an athlete or someone who wants early warning of illness, a device with accurate respiratory rate tracking (low day-to-day variability) and nocturnal RHR is more relevant. If you are simply curious about your sleep architecture, stage data can be interesting for within-device trend tracking, but do not treat the specific numbers as clinically meaningful.
For a detailed comparison of which specific devices track these metrics with the highest accuracy against polysomnography, the site has a comprehensive guide to the best fitness trackers for sleep tracking based on PSG validation data. That article answers the "which device is most accurate" question; this framework answers the "which metric should I prioritize" question.
Caveats and Clinical Context
This framework is designed for health optimization and awareness, not medical diagnosis. No consumer wearable — regardless of how many metrics it tracks — has been cleared by the FDA for predicting cardiovascular events, diagnosing sleep disorders, or detecting infections. The evidence discussed here comes from epidemiological studies and controlled trials, and the associations, while strong, are not causal in the individual case.
There is also the risk of orthosomnia — a term coined by sleep clinicians to describe the unhealthy preoccupation with optimizing wearable sleep data. If tracking a metric causes anxiety or disrupts your sleep, the intervention is counterproductive. The framework is meant to help you focus on the metrics that matter, not to create a new source of stress.
The World Sleep Society's 2025 Sleep Tracker Task Force, led by Chee and colleagues and published in Sleep Medicine, recommended seven Fundamental Sleep Measures (FSMs) for standardized reporting: sleep onset, sleep offset, sleep latency, total sleep time, wake after sleep onset (WASO), sleep efficiency, and duration in light, deep, and REM sleep. The task force acknowledged that wearables can deliver reliable long-term sleep data for healthy users and complement — but not replace — polysomnography for sleep disorder diagnosis. This is a step toward standardization, but it does not change the fact that stage-specific data currently lacks outcome validation.
For a broader definition of what constitutes a good night's sleep — one that goes beyond the metrics discussed here — the site has a five-dimensional framework that covers what actually counts as a good night's sleep. The metric-evidence tier framework is one tool in that larger picture: a way to separate signal from noise in your wearable data, so you can focus on the numbers that are actually telling you something about your health.

Comments
Join the discussion with an anonymous comment.