Why Form Factor Matters More Than Brand for Sleep Tracking
When you search for the best sleep monitoring device, the first thing you encounter is a wall of brand names — Oura, Apple, Fitbit, Whoop, Garmin. But the brand on the box tells you very little about how well the device will actually track your sleep. The form factor — whether you wear it on your finger, your wrist, or place it under your mattress — determines the quality of your sleep data through three mechanisms that no software update can fix: overnight wear compliance, sensor placement physiology, and susceptibility to movement artifacts.
This guide is not a general fitness tracker comparison. We have already covered that ground in our form-factor guide for fitness trackers. Here, we focus specifically on dedicated sleep monitoring devices and provide the mechanistic depth on sensor physiology that explains why a ring on your finger captures different data than a watch on your wrist. If you are deciding which form factor to buy, understanding these differences will serve you better than comparing spec sheets.
Form Factor Comparison at a Glance
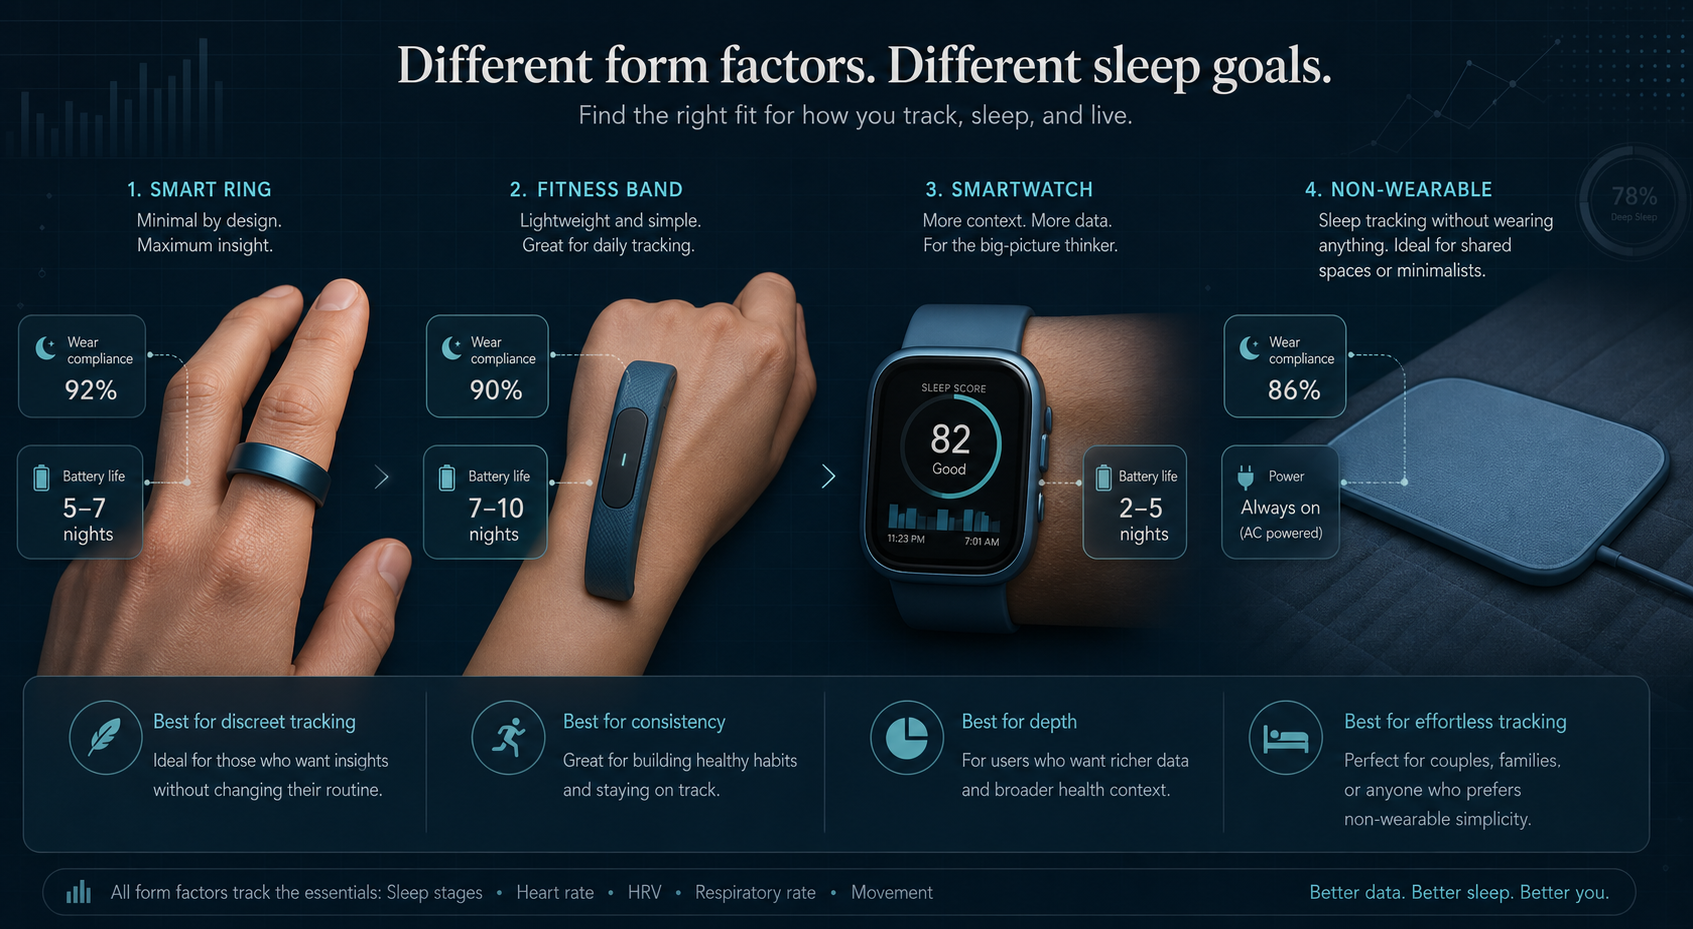
Before diving into the physiology, here is a high-level comparison of the four main form factors available today. The compliance and accuracy figures in this table come from a mix of clinical studies and manufacturer surveys. Where data lacks independent peer-reviewed backing, we note the source so you can calibrate your confidence.
| Metric | Smart Ring | Fitness Band | Smartwatch | Non-Wearable Sensor |
|---|---|---|---|---|
| Overnight wear compliance | ~98% (Jointcorp survey estimate) | ~94% (Jointcorp survey estimate) | ~67% (Jointcorp survey estimate) | 100% (no wear required) |
| Sleep staging accuracy range | 82–95% (clinical studies) | 75–88% (clinical studies) | 73–86% (clinical studies) | N/A (limited staging) |
| Weight | 3–7 g | 25–35 g | 40–80 g | 0 g (bedside) |
| Battery life | 4–14 days | 7–21 days | 18 hours – 7 days | Always powered |
| Key tracked metrics | Sleep stages, HRV, SpO2, body temp | Sleep stages, HR, SpO2 (some) | Sleep stages, HRV, SpO2, ECG | HR, respiration, movement, apnea |
| Typical price range | $299–$449 + subscription | $100–$300 | $250–$800 | $2,999+ (smart bed) |
The compliance gap between rings and smartwatches is striking. If a device claims 98% overnight wear compliance but you take it off every other night to charge, your data stream has holes that undermine longitudinal trend analysis. This is not a minor detail — it is a fundamental constraint on what the device can tell you about your sleep patterns over time.

Why Finger Placement Delivers Superior Sensor Data
The reason a smart ring can capture more reliable physiological signals than a wrist-worn device is anatomical, not technological. The finger's digital arteries are large, superficial, and surrounded by a dense capillary network. This vascular architecture provides a strong, consistent photoplethysmography (PPG) signal with minimal interference from bone, tendon, or muscle. It is the same reason hospital pulse oximeters clamp onto your finger, not your wrist.
The wrist, by contrast, is a complex anatomical junction. The radial and ulnar arteries run deep beneath tendons and the flexor retinaculum. A wrist-worn PPG sensor must contend with diffuse vasculature, greater tissue depth, and significantly more movement artifact from hand and forearm motion during sleep. The result is a noisier signal that requires heavier algorithmic filtering — and filtering inevitably discards or smooths over real physiological variation.
This signal quality difference shows up clearly in the data. The Oura Ring Gen 4 achieved a concordance correlation coefficient (CCC) of 0.99 for nocturnal HRV compared to a Polar H10 ECG chest strap over 536 nights, with a mean absolute percentage error of just 5.96%. That is essentially equivalent to a clinical-grade ECG for heart rate variability measurement. No wrist-worn consumer device has published comparable HRV accuracy against a gold-standard reference.

How Each Form Factor Performs in Clinical Studies
Peer-reviewed validation studies give us the clearest picture of how each form factor performs against polysomnography (PSG), the clinical gold standard for sleep measurement. The table below summarizes key findings from recent studies, organized by form factor. Note that most studies tested older device generations — the Oura Ring Gen 3, Apple Watch Series 8, and Fitbit Sense 2 — so current models may perform differently.
| Device / Form Factor | Key Accuracy Finding | Study Details | Funding Context |
|---|---|---|---|
| Oura Ring Gen 3 (smart ring) | Kappa 0.65 (substantial agreement); no significant bias vs PSG for 7 of 8 measures; sleep latency overestimated by 5 min | Robbins et al. 2024; 35 healthy adults; single-night inpatient PSG | Oura-funded; lead author is Oura advisor |
| Apple Watch Series 8 (smartwatch) | Sleep staging Kappa 0.53; deep sleep underestimated by 43 min (p<0.001); light sleep overestimated by 45 min | Robbins et al. 2024 (same study as above) | Oura-funded |
| Apple Watch (smartwatch) | Kappa 0.53 (independent study); led all devices for sleep staging | Schyvens et al. 2025 (Antwerp); 62 adults; VLAIO-funded | Independent (VLAIO-funded) |
| Fitbit Sense 2 (fitness band) | Light sleep overestimated by 18 min (p<0.001); deep sleep underestimated by 15 min (p<0.001) | Robbins et al. 2024 (same study) | Oura-funded |
| WHOOP (fitness band) | Deep sleep sensitivity 69.6%; best deep sleep detection among tested devices | Schyvens et al. 2025 (Antwerp); independent study | Independent (VLAIO-funded) |
| Withings Sleep Analyzer (non-wearable) | 88% sensitivity for moderate-to-severe sleep apnea | Clinical comparison study (specific study not verified from pre-crawled sources) | Attribution needed — verify source |
A few patterns emerge from this data. First, no consumer device achieves perfect sleep staging — all devices misclassify wake, deep sleep, and REM as light sleep due to conservative algorithms that prioritize avoiding false positives over capturing true stage transitions. Second, the independent Schyvens study found that Apple Watch led all devices for overall sleep staging (Kappa 0.53), while WHOOP led for deep sleep detection (69.6% sensitivity). This underscores a critical point: there is no single "most accurate" device. Accuracy varies by metric, and the device that best tracks your heart rate may not be the one that best stages your sleep.
For deeper dives into individual device accuracy, see our full reviews of the Oura Ring's PSG validation studies, the Apple Watch's accuracy against PSG, and Fitbit's sleep tracking methodology.
The Hidden Cost of Battery Life: Data Completeness and Charging Gaps
Battery life is often treated as a convenience feature, but for sleep tracking it is a data quality issue. A device that requires daily charging will inevitably miss nights — whether because you forgot to charge it, because you charge it during your sleep window, or because the battery died mid-night. These gaps fragment your longitudinal data and reduce the reliability of trend analysis.
| Form Factor | Typical Battery Life | Charging Frequency | Likely Data Completeness |
|---|---|---|---|
| Fitness band | 7–21 days | Every 1–3 weeks | Very high — rarely misses nights |
| Smart ring | 4–14 days | Every 4–14 days | High — occasional short charge during day |
| Smartwatch | 18 hours – 7 days | Daily to every few days | Moderate to low — frequent charging gaps |
| Non-wearable sensor | Always powered | Never | Complete — no charging required |
If your goal is to track sleep trends over weeks or months — for example, to see how your sleep quality changes with exercise, caffeine intake, or stress — a device that captures 95% of nights is far more useful than one that captures 70%. The fitness band and smart ring form factors excel here because their multi-day battery life means you can wear them continuously without thinking about charging. Smartwatches, particularly those with always-on displays and cellular connectivity, often require a nightly charging routine that directly conflicts with sleep tracking.
Non-Wearable Sensors: The No-Wear Alternative
For readers who cannot tolerate wearing anything to bed — whether due to sensory sensitivity, skin reactions, or simply personal preference — non-wearable sensors offer a genuine alternative. These devices sit under your mattress (Withings Sleep Analyzer), integrate into your mattress cover (Eight Sleep Pod 5), or rest on your nightstand (Google Nest Hub's Soli radar). They track heart rate, respiration rate, movement, and in some cases sleep apnea indicators, all without requiring you to wear anything.
The tradeoffs are significant. Non-wearable sensors cannot measure heart rate variability (HRV) or blood oxygen saturation (SpO2) at the same fidelity as a finger-worn PPG sensor. Their sleep staging is based on movement and respiration patterns, not cardiac signals, which limits their ability to distinguish between sleep stages accurately. And the price gap is enormous: the Eight Sleep Pod 5 starts at $2,999 plus a subscription, while a capable fitness band costs under $200.
| Feature | Non-Wearable Sensor | Smart Ring | Fitness Band |
|---|---|---|---|
| Wear required | No | Yes (finger) | Yes (wrist) |
| HRV measurement | Not available | High fidelity (CCC 0.99) | Moderate fidelity |
| SpO2 measurement | Not available | Available | Available (some models) |
| Sleep apnea screening | Available (88% sensitivity) | Limited | Limited |
| Typical price | $2,999+ (smart bed) | $299–$449 | $100–$300 |
| Subscription required | Yes (most models) | Yes (most models) | Optional (some models) |
The Withings Sleep Analyzer showed 88% sensitivity for moderate-to-severe sleep apnea in clinical comparisons, making it a potentially useful screening tool for sleep-disordered breathing. However, this figure should be attributed to the specific clinical comparison study, and no consumer device — wearable or non-wearable — can replace a clinical sleep study (polysomnography) for diagnosing sleep disorders.
Which Form Factor Is Right for Your Sleep Goals?
The right form factor depends on what you want to get out of sleep tracking. The decision matrix below maps user priorities to the form factor that best serves them. No single device wins across all dimensions — the goal is to match the device to your specific needs.
| Your Priority | Recommended Form Factor | Why | Example Device |
|---|---|---|---|
| Maximum accuracy for HRV and sleep staging | Smart ring | Finger placement provides strongest PPG signal; highest HRV accuracy (CCC 0.99); best sleep staging Kappa (0.65) | Oura Ring Gen 4 |
| Best value for reliable sleep tracking | Fitness band | Good accuracy at lower price; long battery life ensures data completeness; no subscription required on some models | Fitbit Inspire 3 |
| All-in-one device for health and fitness | Smartwatch | Combines sleep tracking with ECG, SpO2, GPS, and notifications; best for users who want one device for everything | Apple Watch Series 9 |
| No-wear preference or sleep apnea screening | Non-wearable sensor | No wear compliance issues; can screen for sleep apnea; but limited HRV/SpO2 and high cost | Withings Sleep Analyzer |
| Deep sleep optimization focus | Fitness band (WHOOP) | WHOOP showed best deep sleep sensitivity (69.6%) in independent study | WHOOP 4.0 |

Important Caveats: Study Funding, Device Generations, and Data Gaps
The accuracy data in this article comes from specific studies with important context that readers should understand before making a purchase decision.
First, study funding matters. The Robbins et al. (2024) study that provides much of the Oura Ring accuracy data was funded by Oura Ring Inc., and the lead author is an Oura scientific advisor. The independent Schyvens et al. (2025) study, funded by the VLAIO research agency in Belgium, found different relative performance — Apple Watch led for overall sleep staging (Kappa 0.53), while WHOOP led for deep sleep detection (69.6%). Neither study is "wrong," but they reflect different methodologies, populations, and potential biases. Our comprehensive evidence review of smartwatch sleep tracker accuracy provides deeper context on how study design affects results.
Second, device generations matter. Most PSG validation studies tested the Oura Ring Gen 3, Apple Watch Series 8, and Fitbit Sense 2. Current models — Oura Ring 4, Apple Watch Series 11, Fitbit Charge 6 — may perform differently due to updated sensors, algorithms, or form-factor changes. Always check the specific model's validation data rather than assuming the brand's reputation applies to every generation.
Third, all consumer devices share a fundamental limitation: they estimate sleep stages using proxy signals (heart rate, movement, respiration) rather than measuring brain waves directly via EEG. This means they systematically misclassify wake, deep sleep, and REM as light sleep. The Johns Hopkins Medicine guide to sleep trackers puts it plainly: "Most sleep tracking devices make some guesstimate as to how much you're actually sleeping." This does not make them useless — it means you should treat the numbers as directional trends, not clinical measurements.
Finally, a brief note on orthosomnia — the perfectionistic quest for ideal sleep driven by tracker data. If you find yourself anxious about your sleep score, checking your data multiple times per night, or feeling distressed by "poor" sleep metrics despite feeling well-rested, the tracker may be doing more harm than good. The concept was first described in the Journal of Clinical Sleep Medicine in 2017, and clinicians have noted a growing number of patients seeking treatment for self-diagnosed sleep disturbances based on tracker data. Use your device as a tool for awareness, not a source of anxiety.
Comments
Join the discussion with an anonymous comment.