When a WHOOP sleep tracker tells you that you slept 7 hours and 12 minutes, spent 1 hour and 48 minutes in REM, and recovered poorly, two things can be true at once: the duration estimate may be quite good, and the stage chart may still be much less certain than it looks.
The strongest published evidence puts WHOOP in a favorable position among consumer wearables for total sleep time. In a 2024 systematic review comparing WHOOP, Fitbit Charge 4, and Garmin Vivosmart 4 against polysomnography, WHOOP had the smallest mean bias for total sleep time at -1.4 minutes, and also small average biases for light sleep and deep sleep at -9.6 and -9.3 minutes respectively. The same review, however, found that WHOOP overestimated REM sleep by 21.0 minutes on average, achieved about 62% four-stage epoch-by-epoch agreement, and had a Cohen’s κ of 0.46 against PSG scoring.[1]
That is the useful starting point: WHOOP appears unusually strong for tracking sleep duration trends, but its hypnogram is not a clinical record. A 62% four-stage agreement means that, roughly speaking, about four in ten scored sleep-stage epochs do not match PSG. The device can still be useful; it just should not be treated as if each colored block on the chart were directly observed.

What WHOOP actually measures while you sleep
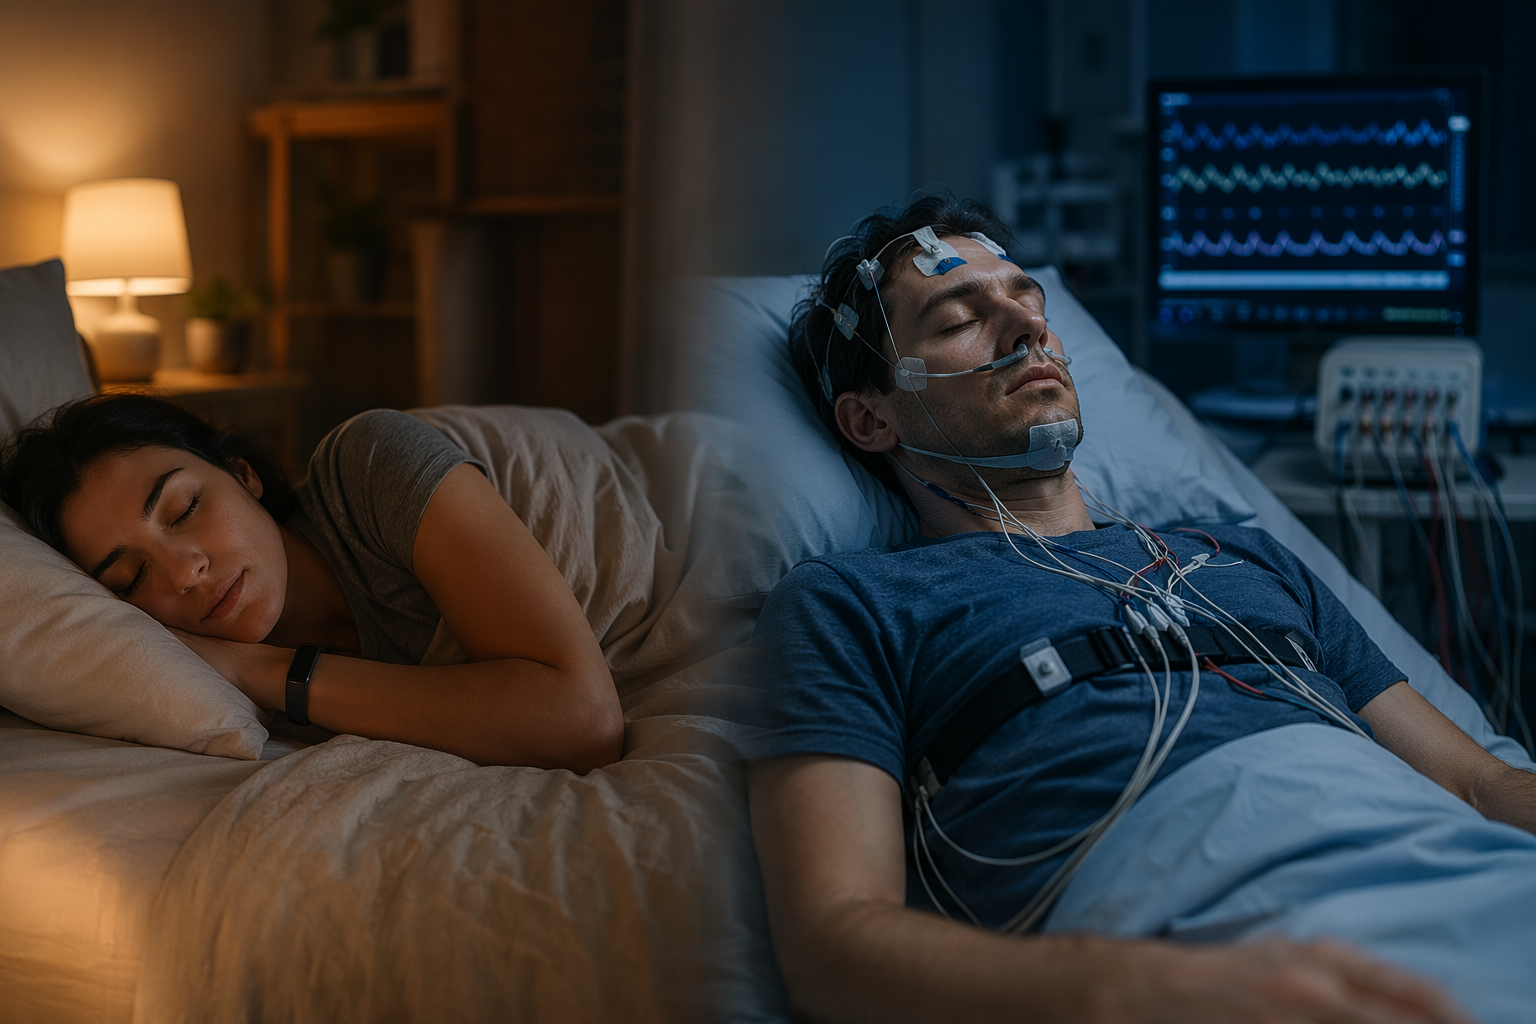
WHOOP does not measure brain waves. PSG, the clinical sleep-study method used as the comparison standard in validation studies, combines signals such as EEG, eye movement, muscle tone, breathing, oxygen, and other channels to score sleep. WHOOP sits on the wrist and works from indirect signals: movement from a triaxial accelerometer and cardiovascular signals from an optical photoplethysmography sensor, including heart rate and heart rate variability patterns.
WHOOP’s own sleep documentation describes a pipeline that detects sleep, estimates time in bed and sleep duration, and classifies sleep into wake, light, slow-wave sleep, and REM using movement and physiological patterns.[2] That manufacturer explanation is useful for understanding the intended logic, but it is not the same kind of evidence as an independent comparison against PSG.
The basic inference is plausible. People usually move less during sleep than during wake. Heart rate and HRV tend to shift across the night. REM, deep sleep, and lighter sleep are associated with different autonomic patterns. But the wrist does not see the brain enter REM; it sees a combination of stillness, pulse-derived signals, and context, then assigns the most likely label.

From sensor signal to sleep stage: where certainty gets added
The difficult part is not detecting that someone is probably asleep for much of the night. The difficult part is separating quiet wake from sleep, and then separating light sleep, deep sleep, and REM from one another using wrist-based signals.
A simplified version of the flow looks like this:
| Layer | What WHOOP can observe or estimate | Where interpretation enters |
|---|---|---|
| Movement | Wrist motion and stillness from the accelerometer | Stillness can suggest sleep, but quiet wake can look similar |
| Heart signal | Optical pulse data, heart rate, and HRV-derived patterns | Autonomic patterns can support sleep-stage inference, but they do not directly identify brain state |
| Sleep detection | Likely sleep start, wake time, disturbances, and total sleep duration | Short awakenings and motionless wake are easy to miss |
| Stage classification | Wake, light, deep, and REM labels across the night | The algorithm turns probabilistic signals into a clean hypnogram |
| Scores and coaching | Sleep performance, recovery, strain context, and suggested sleep need | Composite scores can feel more definitive than the underlying measurement supports |
This is where the user experience can outrun the evidence. A smooth chart makes stage labels feel as if they were directly measured. In reality, the chart is the output of a proprietary model interpreting imperfect signals. WHOOP may be doing that interpretation better than many consumer devices in some domains, but it is still interpretation.
WHOOP has also reported a Central Queensland University finding of 99.7% heart-rate accuracy during sleep.[3] That is relevant context because heart rate is one of the inputs used in sleep inference. It does not, by itself, validate sleep-stage accuracy. A device can measure pulse well and still misclassify REM, light sleep, or quiet wake.
What PSG validation says about WHOOP accuracy
The most useful evidence comes from studies that compare WHOOP to PSG on the same night. In the 2024 systematic review, WHOOP’s average total sleep time bias of -1.4 minutes is genuinely impressive for a wrist wearable. It means that across the reviewed WHOOP data, the device’s average total sleep estimate was almost identical to PSG. The review also found relatively small average biases for light sleep and deep sleep, at -9.6 and -9.3 minutes.[1]
The REM result is less comfortable. WHOOP overestimated REM sleep by 21.0 minutes on average in that review.[1] Twenty-one minutes is not a rounding error for someone looking at a recovery dashboard and deciding whether last night’s sleep architecture was “good.” It is enough to change the story a user tells themselves about the night.
| Metric in the 2024 review | WHOOP result versus PSG | How to read it |
|---|---|---|
| Total sleep time | Mean bias: -1.4 minutes | Strong for average duration tracking |
| Light sleep | Mean bias: -9.6 minutes | Small average bias, but individual epochs can still be misclassified |
| Deep sleep | Mean bias: -9.3 minutes | Small average bias, not a guarantee of precise stage timing |
| REM sleep | Mean bias: +21.0 minutes | Meaningful average overestimation |
| Four-stage agreement | About 62% | Moderate stage-level match; many epochs differ from PSG |
| Cohen’s κ | 0.46 | Moderate agreement, below PSG technician inter-scorer reliability |
| Sleep/wake agreement | About 89% | Looks strong, but depends heavily on detecting sleep well |
| Sleep sensitivity | 95% | Good at identifying sleep when PSG says sleep |
| Wake specificity | About 56% | Much weaker at identifying wake when PSG says wake |
The sensitivity-specificity split matters more than the headline sleep/wake agreement. A 95% sensitivity for sleep means WHOOP was very good at labeling PSG-scored sleep as sleep. But about 56% specificity for wake means wake detection was much weaker.[1] If you lie still in bed awake, that is exactly the kind of state a wrist tracker can struggle with.
Miller and colleagues’ WHOOP validation work is part of the reason the device has a stronger evidence base than many wearables. Those studies compared WHOOP generations against PSG and helped establish that WHOOP can estimate sleep duration and some sleep measures with useful accuracy in controlled settings.[4] Still, most published validation work has involved WHOOP 3.0 or 4.0, not direct testing of the current 5.0/MG hardware. If the hardware and algorithms have improved, that may help, but the PSG evidence should not be silently transferred as if every new device generation had already been independently validated.
There is another reason to avoid treating PSG comparison as a magic stamp. PSG itself is scored by humans, and scoring is not perfectly uniform. The same systematic review reported PSG technician inter-scorer reliability at κ=0.75, higher than WHOOP’s κ=0.46, but not flawless.[1] That does not excuse consumer-device error; it simply keeps the comparison honest. WHOOP is being judged against the best practical standard, not against an infallible oracle.
Small average bias does not mean your REM number is exact
Mean bias is easy to misread. A near-zero average error for total sleep time does not mean every individual night is near-perfect. Errors can cancel out across people and nights. A device may overestimate one user, underestimate another, miss a wake period, and still look excellent on average.
Stage-level agreement is stricter and more revealing. Sleep is scored in epochs, and each epoch receives a label. If WHOOP’s four-stage agreement is about 62%, then the nightly chart should be read as an estimated pattern, not a precise diary of when your brain entered REM or deep sleep.[1]
This distinction is especially important because WHOOP presents stage data in a way that invites behavioral interpretation. A user may see low deep sleep and decide the previous workout was too late, or see high REM and assume recovery is excellent. Sometimes those interpretations may be directionally useful. Sometimes they may be built on a mislabeled portion of the night.
A better use of the WHOOP sleep tracker is to watch repeated patterns: whether total sleep time is sliding down during heavy training blocks, whether sleep consistency is poor, whether long nights are followed by better subjective recovery, or whether alcohol, travel, illness, or late strain reliably changes the next morning’s metrics. The more granular the claim, the more caution it deserves.
How WHOOP compares with other devices in real use
Cross-device comparisons are not the same as PSG validation, but they do show what users experience when two polished apps describe the same night differently.
Terra Research reported 2026 overlapping-night data from 2,144 nights across 725 users. In the WHOOP-versus-Oura subset, the median total sleep time difference was about 16.6 minutes. WHOOP reported longer total sleep than Oura on 57% of nights and longer total sleep than Eight Sleep on 81% of nights. Stage-level disagreements were much larger than total sleep time disagreements, with light-sleep discrepancies exceeding 250 minutes in some device pairs.[5]
That finding should be weighted carefully. The Terra analysis was industry-sponsored, not peer-reviewed, and the device-pair samples were modest, with 31 to 42 nights per pair.[5] It should not replace PSG validation as the backbone of an accuracy judgment. Its value is more practical: it shows why two reasonable devices can agree roughly on duration while telling very different stories about sleep stages.
For shoppers comparing rings and bands, the next question is not just which device has the prettier sleep graph, but which metric they care about most. A deeper head-to-head is covered in Oura Ring vs. WHOOP for Sleep Tracking. The broader device landscape, including PSG-based comparisons, is covered in Which Fitness Tracker Is Most Accurate for Sleep?.
What to trust, what to downshift
The fairest interpretation is not “WHOOP is accurate” or “WHOOP is wrong.” It depends on the level of claim.
| WHOOP sleep output | Best use | Confidence level |
|---|---|---|
| Total sleep time | Tracking week-to-week sleep duration and sleep debt patterns | Relatively strong for a consumer wearable, based on small mean bias versus PSG |
| Sleep/wake periods | Seeing broad bedtime, wake time, and disturbance patterns | Useful, but quiet wake can be missed |
| REM minutes | Directional trend only | Treat cautiously because WHOOP overestimated REM by about 21 minutes on average |
| Light and deep sleep minutes | Longer-term pattern watching, not exact nightly scoring | Average bias was small, but epoch-level agreement was only moderate |
| Recovery and sleep scores | Context for training and routine decisions | Depends on multiple modeled inputs; do not reduce the morning to one color |
Composite scores deserve a separate kind of caution. WHOOP’s sleep and recovery outputs combine measured and inferred signals into a simplified recommendation layer. If the score helps you notice that five short nights are catching up with you, useful. If it makes you reinterpret a morning that feels fine as a failure because REM was low, the score is doing too much work. For a closer look at this layer, see Sleep Score Explained.
The metric hierarchy also matters. Total sleep time, sleep regularity, and sustained sleep restriction usually have clearer practical meaning than a single-night swing in REM or deep sleep on a wrist device. Readers trying to separate high-value metrics from decorative precision may find the wearable sleep metrics and health outcomes framework more useful than another night of zooming into the hypnogram.
The evidence has limits
The 2024 review is the strongest anchor here, but its WHOOP-specific evidence was not huge. It included four WHOOP validation studies with sample sizes ranging from 5 to 53 participants, mostly in controlled laboratory settings.[1] That is enough to take the findings seriously, not enough to pretend the question is closed for every user, age group, sleep disorder, medication profile, skin tone, training load, or home environment.
A 2024 systematic review by Khodr and colleagues also examined WHOOP’s accuracy, utility, and applicability across health domains, reinforcing the broader point that WHOOP has promising uses but that evidence quality and applicability vary by metric and context.[6] A sleep-stage estimate used for personal trend awareness is a different claim from a sleep-stage estimate used for diagnosis.
Current WHOOP users should also separate product continuity from direct evidence. Published PSG validation has mostly tested earlier WHOOP generations. The present device may use different hardware or algorithms, and WHOOP can update models over time. That may improve performance, but without a directly comparable PSG validation study, the improvement remains an inference.
When sleep data starts changing your sleep
The problem with granular sleep data is not only measurement error. It is the emotional authority the app can acquire. Orthosomnia literature describes cases where people become preoccupied with optimizing tracker-defined sleep, sometimes worsening anxiety around sleep itself.[7] Jahrami and colleagues’ 2023 work likewise discusses sleep-tracker use in the context of sleep-related worry and perfectionism.[8]
WHOOP is not uniquely guilty of this; it is simply built in a way that can make the temptation stronger. The app gives recovery colors, strain targets, sleep need, sleep performance, and stage minutes. For some people, that structure encourages better routines. For others, it turns an imperfect classification system into a nightly verdict.
A practical boundary is to let WHOOP inform behavior at the level the evidence supports. If the device shows that your sleep duration drops whenever work travel starts, believe the pattern. If it says your REM was 23 minutes lower than usual last night, hesitate before reorganizing the day around that number. If you feel alert and rested but the score says otherwise, your lived state still counts.
If sleep scores have started making bedtime feel like a performance review, the broader guide to sleep tracker accuracy and orthosomnia risk is a better next step than buying another device.
The bottom line for interpreting WHOOP sleep data
WHOOP’s sleep tracker is credible for monitoring sleep duration trends, especially over weeks rather than single nights. Its PSG validation record is stronger than casual skepticism would suggest, and its total sleep time bias in the 2024 review was notably small.[1]
The sleep-stage chart needs a lighter touch. REM, light sleep, and deep sleep estimates are directional signals produced by an algorithm, not clinical-grade measurements. WHOOP can help you see patterns in rest, strain, and recovery. It should not be allowed to decide, by itself, whether the night you just lived was successful.
References
- Accuracy of commercially available wearable devices for sleep staging: a systematic review and meta-analysis. PMC. 2024.
- How WHOOP Measures Sleep. WHOOP Locker.
- WHOOP 4.0 Is the Most Accurate Wearable in the World. WHOOP Locker.
- Validation of a Commercially Available Wearable Device for Sleep and Heart Rate Variability. PubMed. 2020.
- Comparing Sleep Metrics Across Consumer Sleep Trackers. Terra Research. 2026.
- Accuracy, utility and applicability of the WHOOP wearable health tracker: a systematic review. medRxiv. 2024.
- Orthosomnia: Are Some Patients Taking the Quantified Self Too Far?. Journal of Clinical Sleep Medicine. 2017.
- Sleep tracker use, sleep-related worry, and orthosomnia: a systematic review. 2023.
Comments
Join the discussion with an anonymous comment.